|
|
APPENDIX A
MEDIUM RANGE FORECAST
2002-03 TO 2007-08 |
| |
INTRODUCTION
The Medium Range Forecast (MRF) is a projection of expenditure and
revenue for the forecast period based on the forecasting assumptions and
budgetary criteria outlined in Section I of this Appendix.
2
The MRF is presented in three sections:
(I) Forecasting assumptions
and budgetary criteria.
(II) The MRF for
2002-03 to 2007-08.
(III) Relationship
between Government Expenditure, Public Expenditure and GDP in the MRF.
3
Government's contingent
liabilities at 31 March 2002 and an estimate at 31 March 2003 and 31 March
2004 respectively are provided in
Section IV of this Appendix as supplementary information to the MRF.
SECTION I - FORECASTING ASSUMPTIONS AND BUDGETARY
CRITERIA
4
A number of computer based models are
used to derive the MRF. These models reflect a
wide range of assumptions about the factors determining
each of the components of Government's revenue
and expenditure. Some are economic in nature (the
general economic assumptions) while others deal
with specific areas of Government's activity (the
detailed assumptions). These are supported by
studies of historical and anticipated trends.
General Economic Assumptions
Real Gross Domestic Product
(real GDP)
5
For planning purposes, the assumption on the trend growth rate in real terms of GDP for the medium-term period 2003 to 2007 is set at 3% per annum (comprising a 3% growth for 2003, and an average growth of also 3% per annum for the ensuing period 2004 to 2007).
Price change
6
Over the period 2003 to 2007, the trend rate of change in the GDP deflator, as measuring overall price change in the economy, is assumed at 0% per annum (comprising a decrease of 2% for 2003, and an average increase of 0.5% per annum for the ensuing period 2004 to 2007), and the trend rate of change in the Composite Consumer Price Index, as measuring price change in the consumer domain, is assumed at a 0.5% increase per annum (comprising a decrease of 1.5% for 2003, and an average increase of 1% per annum for the ensuing period 2004 to 2007).
Nominal Gross Domestic
Product (nominal GDP)
7
Taking the assumptions on the trend rates of change in the real GDP and the GDP deflator together, the trend growth rate of nominal GDP is thus assumed at 3% for the period 2003 to 2007(comprising a 1% growth for 2003, and an average growth of 3.5% for the ensuing period 2004 to 2007).
Detailed Assumptions
8
A wide range of detailed assumptions
relating to developing expenditure and revenue patterns over the forecast
period are taken into account. These include:
-
estimated cash flow of capital projects.
-
forecast completion dates of these capital projects and their related
recurrent consequences in terms of staffing and running costs.
-
estimated cash flow arising from new commitments resulting from policy
initiatives.
-
the expected pattern of demand for individual services.
-
the trend in yield from individual revenue sources.
-
new revenue/expenditure measures in the
2003 Budget.
Budgetary Criteria
9
In addition to the above forecasting assumptions there
are a number of criteria against which the results
of forecasts are tested for overall acceptability
in terms of budgetary policy. Any significant
breach of important budgetary criteria results
in a review and adjustments, where necessary,
of the expenditure and revenue projections.
10 The following are the more important
budgetary criteria:
The Government aims to achieve balance in
consolidated and operating accounts by 2006-07. In the longer term, the
Government needs to achieve an operating surplus to partially finance
capital expenditure.
-
Total expenditure growth
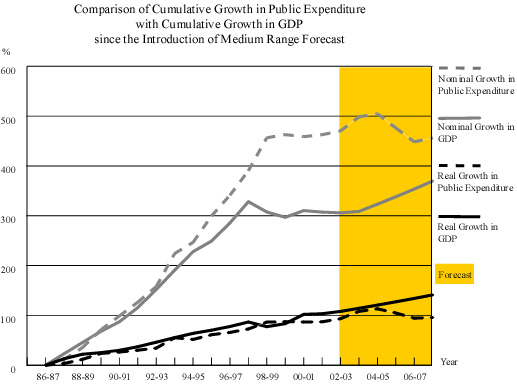
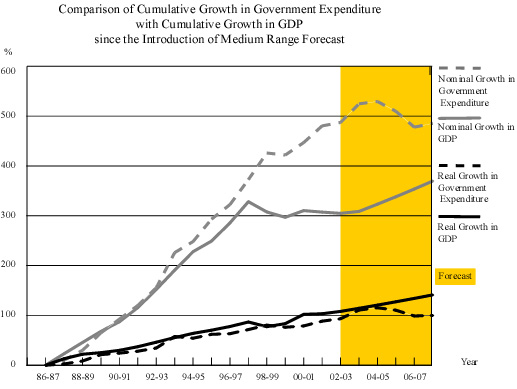
The general principle is that, over time, expenditure growth should
not exceed the growth of the economy, taking into account both real and
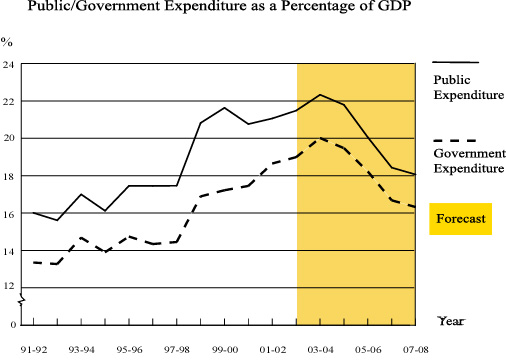
nominal terms. The Government aims to keep public expenditure at or below
20% of GDP by 2006-07.
-
Capital expenditure growth
By its nature some fluctuations in the level of
capital expenditure are to be expected. However, over a period the aim is
to contain capital expenditure growth within overall expenditure
guidelines.
SECTION II - THE MRF FOR
2002-03 TO 2007-08
11
The current MRF (Note
a) is summarised in the following three
tables which indicate the forecast operating position,
capital financing position and consolidated reserves
position.
| |
Original Estimate |
Revised Estimate |
Forecast |
| 2002-03 |
2002-03 |
2003-04 |
2004-05 |
2005-06 |
2006-07 |
2007-08 |
| $m |
$m |
$m |
$m |
$m |
$m |
$m |
| Operating revenue (Note b) |
149,400 |
135,060 |
149,180 |
165,950 |
181,900 |
190,910 |
194,540 |
| Less: Operating Expenditure (Note c) |
209,380 |
200,660 |
210,270 |
207,270 |
203,400 |
199,760 |
202,990 |
| Operating surplus/(deficit) before
extraordinary expenditure/investment income |
(59,980) |
(65,660) |
(61,090) |
(41,320) |
(21,500) |
(8,850) |
(8,450) |
Extraordinary expenditure:
Voluntary Retirement Scheme (Note c) |
(1,980) |
(1,950) |
(3,330) |
(4,920) |
- |
- |
- |
| Operating surplus/(deficit) before
investment income |
(61,960) |
(67,550) |
(64,420) |
(46,240) |
(21,500) |
(8,850) |
(8,450) |
| Investment income (Note b) |
12,640 |
14,590 |
11,000 |
8,820 |
8,410 |
8,390 |
8,750 |
| Operating surplus/(deficit) after
investment income |
(49,320) |
(52,960) |
(53,420) |
(37,420) |
(13,090) |
(460) |
300 |
Capital Financing Statement |
Table 2 |
| |
Original Estimate |
Revised Estimate |
Forecast |
| 2002-03 |
2002-03 |
2003-04 |
2004-05 |
2005-06 |
2006-07 |
2007-08 |
| $m |
$m |
$m |
$m |
$m |
$m |
$m |
| Capital revenue (Note d) |
36,440 |
22,340 |
11,240 |
20,540 |
26,750 |
27,780 |
29,100 |
| Sale of
government assets (Note d) |
15,000 |
- |
21,000 |
30,000 |
24,000 |
21,000 |
16,000 |
| Less : |
General Revenue Account capital expenditure (Note e) |
4,160 |
2,050 |
2,000 |
1,430 |
3,860 |
3,970 |
4,030 |
: |
Expenditure on capital projects (Note f) |
34,360 |
32,270 |
36,200 |
39,110 |
37,010 |
29,470 |
29,520 |
| |
Loans and investments
(Notes g) |
9,370 |
6,120 |
8,000 |
10,790 |
11,610 |
6,840 |
3,620 |
| |
Aid for disaster relief (Note h) |
- |
10 |
- |
- |
- |
- |
- |
| |
Expenditure for innovation and technology (Note
i) |
560 |
330 |
520 |
610 |
640 |
120 |
120 |
| |
Grants and
loans for social welfare services (Note k) |
- |
- |
1,080 |
1,390 |
1,360 |
640 |
640 |
| Capital financing
surplus/(deficit) before investment income |
2,990 |
(18,440) |
(15,560) |
(2,790) |
(3,730) |
7,740 |
7,170 |
| Investment income (Note d) |
1,120 |
1,350 |
1,110 |
1,990 |
1,040 |
870 |
930 |
| Capital financing
surplus/(deficit) after investment |
4,110 |
(17,090) |
(14,450) |
(800) |
(2,690) |
8,610 |
8,100 |
| Consolidated Reserves |
Table 3 |
|
Original Estimate |
Revised Estimate |
Forecast |
| 2002-03 |
2002-03 |
2003-04 |
2004-05 |
2005-06 |
2006-07 |
2007-08 |
| $m |
$m |
$m |
$m |
$m |
$m |
$m |
| Fiscal Reserves at 1 April (Note j) |
369,760 |
372,500 |
303,040 |
239,140 |
200,920 |
185,140 |
193,290 |
| Lotteries Fund
balance at 1 April |
- |
- |
3,970 |
- |
- |
- |
- |
|
(49,320) |
(52,960) |
(53,420) |
(37,420) |
(13,090) |
(460) |
300 |
|
4,110 |
(17,090) |
(14,450) |
(800) |
(2,690) |
8,610 |
8,100 |
| Consolidated surplus/(deficit) |
(45,210) |
(70,050) |
(67,870) |
(38,220) |
(15,780) |
8,150 |
8,400 |
Write-back of provision for loss in investments with the Exchange
Fund |
1,030 |
590 |
- |
- |
- |
- |
- |
| Fiscal Reserves at 31 March (Note
j) |
325,580 |
303,040 |
239,140 |
200,920 |
185,140 |
193,290 |
201,690 |
As number of months of Government Expenditure |
15 |
15 |
11 |
9 |
9 |
10 |
10 |
Notes on the Medium Range Forecast
(a) |
Accounting policies |
|
|
|
(i) |
The Medium Range Forecast, like Government's Accounts,
is prepared on a cash basis and reflects forecast receipts and
payments, whether or not they relate to recurrent or capital
transactions. |
|
(ii) |
The Medium Range Forecast includes the General Revenue
Account and the Funds (the Capital Investment Fund, the Capital Works Reserve Fund, the
Civil Service Pension Reserve Fund, the Disaster Relief Fund, the Innovation
and Technology Fund, the Land Fund, the Loan
Fund, and the Lotteries Fund with effect from 1 April 2003 ). |
|
|
|
(b) |
Operating revenue |
|
|
|
|
(i) |
Operating revenue is defined in Appendix C. |
|
(ii) |
For the purpose of the Medium Range
Forecast, the
investment earnings of the balance of the General Revenue Account
which is credited to revenue head Properties and Investments and the
investment earnings of the Land Fund are consolidated and shown
separately under Investment Income in Table 1. The rate of return on
investment earnings is assumed at 4.5% in 2003-04 and 5% in 2004-05 to
2007-08. |
|
(iii) |
The level of operating revenue in
2003-04 has taken
into account the revenue concession and revenue-raising measures in
the 2003 Budget. |
|
|
|
(c) |
Operating expenditure |
|
|
|
|
(i) |
Operating expenditure is defined in Appendix C. |
|
(ii) |
The operating expenditure in
2002-03 to 2004-05
includes provision for expenditure under the first and second
Voluntary Retirement Schemes. The one-off expenditure under these
schemes comprises commuted pensions and compensation for takers of
the schemes. The forecast remaining expenditure for the first
Voluntary Retirement Scheme introduced in 2000-01 is $1.9 billion in
2002-03 and $0.1 billion in 2003-04. The forecast expenditure for the second Voluntary
Retirement Scheme to
be introduced in 2003-04 is $3.2 billion in 2003-04 and $4.9 billion
in 2004-05. |
|
(iii) |
The level of operating expenditure in 2003-04 to 2007-08 has assumed a 6% reduction in the salaries of the civil service and the salary-related portion of recurrent subventions which will take effect by two equal instalments, i.e. on 1 January 2004 and 1 January 2005. This assumed salary reduction, if implemented, will save about $0.9 billion in 2003-04, $4.3 billion in 2004-05 and $6.9 billion from 2005-06. For the purpose of measuring real change in expenditure levels, it has also incorporated the adjustment to the standard payment rates of the Comprehensive Social Security Assistance and Social Security Allowance announced in February 2003. |
|
|
|
(d) |
Capital revenue |
|
|
|
|
(i) |
The breakdown of capital
revenue to the General Revenue Account and the Funds is -
|
|
2002-03 |
2003-04 |
2004-05 |
2005-06 |
2006-07 |
2007-08 |
|
$m |
$m |
$m |
$m |
$m |
$m |
| General Revenue Account |
5,000 |
8,750 |
28,740 |
26,400 |
23,460 |
18,530 |
| Capital Works Reserve Fund |
11,790 |
3,050 |
14,500 |
19,700 |
20,210 |
20,920 |
| Capital Investment Fund |
2,430 |
2,330 |
2,280 |
2,330 |
2,290 |
2,390 |
| Civil Service Pension Reserve Fund |
560 |
590 |
710 |
750 |
790 |
830 |
| Innovation and Technology Fund |
230 |
100 |
110 |
0 |
0 |
0 |
| Loan Fund |
3,680 |
17,690 |
5,350 |
1,870 |
2,160 |
2,620 |
| Lotteries Fund |
- |
840 |
840 |
740 |
740 |
740 |
|
_______ |
_______ |
_______ |
_______ |
_______ |
_______ |
| Total |
23,690 |
33,350 |
52,530 |
51,790 |
49,650 |
46,030 |
|
_______ |
_______ |
_______ |
_______ |
_______ |
_______ |
|
|
|
|
|
|
|
|
(ii) |
For the purpose of the Medium Range Forecast, the investment earnings on the balances of the Funds other than the Land Fund are shown separately under Investment Income in Table 2. The forecast proceeds from sale of assets have been incorporated in the capital revenue: $21 billion in 2003-04; $30 billion in 2004-05; $24 billion in 2005-06; $21 billion in 2006-07 and $16 billion in 2007-08. |
|
(iii) |
For the purpose of the Medium Range Forecast, the annual land
premia included under the Capital Works Reserve Fund for 2004-05 and 2005-06 to 2007-08 are respectively assumed at 1% and 1.4% of GDP. |
|
|
(e) |
General Revenue Account capital
expenditure |
|
|
|
This comprises expenditure chargeable to the General
Revenue Account in respect of purchase of equipment and works of a
minor nature. |
|
|
(f) |
Expenditure on capital projects |
|
|
|
This comprises expenditure chargeable to the Capital
Works Reserve Fund in respect
of the Public Works Programme, land
acquisition, capital subventions, major systems and equipment and
computerisation. |
|
|
(g) |
Loans and investments |
|
|
|
(i) |
These comprise loans made from the Loan Fund,
including loans to schools, teachers, students, housing loans, and
loans under the special finance scheme for small and medium
enterprises, and advances and equity investments made from the
Capital Investment Fund mainly to Trading Funds and
government-owned corporations. |
|
|
|
|
(ii) |
The forecast of payments from the Loan Fund is - |
|
|
|
|
|
2002-03 |
2003-04 |
2004-05 |
2005-06 |
2006-07 |
2007-08 |
|
$m |
$m |
$m |
$m |
$m |
$m |
|
3,140 |
3,420 |
3,980 |
4,370 |
3,580 |
3,370
|
|
|
|
|
(iii) |
The forecast of payments from the Capital
Investment Fund is -
|
|
|
2002-03 |
2003-04 |
2004-05 |
2005-06 |
2006-07 |
2007-08 |
|
$m |
$m |
$m |
$m |
$m |
$m |
|
2,980 |
4,580 |
6,810 |
7,240 |
3,260 |
250 |
|
|
(h) |
Aid for disaster relief |
|
|
|
This is actual expenditure made from the Disaster
Relief Fund for providing relief to disasters that occur outside
Hong Kong. Because of the unpredictable nature of disasters, no
estimate of future expenditure is made for the forecast period. |
|
|
(i) |
Expenditure for Innovation and Technology |
|
|
|
This comprises expenditure chargeable to the
Innovation and Technology Fund to finance projects to help promote
innovation and technology upgrading in manufacturing and service
industries. |
|
|
(j) |
Fiscal reserves |
|
|
|
The fiscal reserves represent the accumulated balances
of the General Revenue Account and the Funds, including the
Lotteries Fund, from 1 April 2003. |
|
|
(k) |
Grants and loans for social welfare services |
|
These comprise grants, loans and advances made from
the Lotteries Fund for social welfare services. |
|
|
|
|
Government Expenditure and Public Expenditure in the Context of the Economy |
Table 4 |
| |
Original Estimate |
Revised Estimate |
Forecast |
| 2002-03 |
2002-03 |
2003-04 |
2004-05 |
2005-06 |
2006-07 |
2007-08 |
| $m |
$m |
$m |
$m |
$m |
$m |
$m |
| Operating expenditure |
211,360 |
202,610 |
213,600 |
212,190 |
203,400 |
199,760 |
202,990 |
| Capital expenditure |
42,890 |
37,800 |
43,220 |
46,520 |
47,240 |
37,780 |
37,680 |
| Total government expenditure |
254,250 |
240,410 |
256,820 |
258,710 |
250,640 |
237,540 |
240,670 |
| Add: Other public bodies |
32,930 |
32,650 |
29,700 |
30,850 |
25,210 |
24,990 |
25,710 |
| Total public expenditure (Note 1) |
287,180 |
273,060 |
286,520 |
289,560 |
275,850 |
262,530 |
266,380 |
| Gross Domestic Product (calendar year) |
1,256,210 |
1,271,080 |
1,283,230 |
1,328,620 |
1,375,600 |
1,424,250 |
1,474,620 |
| Growth in GDP (Note 2) |
|
|
|
|
|
|
|
|
|
-0.6% |
1.0% |
3.5% |
3.5% |
3.5% |
3.5% |
|
|
2.3% |
3.0% |
3.0% |
3.0% |
3.0% |
3.0% |
| Growth in government expenditure |
|
|
|
|
|
|
|
|
|
+0.8% |
+6.4% |
+0.7% |
-3.1% |
-5.2% |
+1.3% |
|
|
+2.6% |
+9.0% |
+2.2% |
-2.3% |
-5.5% |
+0.4% |
| Growth in public expenditure |
|
|
|
|
|
|
|
|
|
+1.4% |
+4.9% |
+1.1% |
-4.7% |
-4.8% |
+1.5% |
|
|
+3.4% |
+7.6% |
+2.5% |
-4.0% |
-5.1% |
+0.7% |
| Government expenditure as a percentage of GDP |
|
18.9% |
20.0% |
19.5% |
18.2% |
16.7% |
16.3% |
| Public expenditure as a percentage of GDP |
22.9% |
21.5% |
22.3% |
21.8% |
20.1% |
18.4% |
18.1% |
|
|
| Note 1 |
Public expenditure comprises government expenditure (i.e. all expenditure charged to the General Revenue Account and financed by the Government's statutory funds excluding Capital Investment Fund), and expenditure by the Trading Funds and the Housing Authority. But not included is expenditure by those organisations, including statutory organisations, in which the Government has only an equity position, such as the Airport Authority, the MTR Corporation Ltd and the Kowloon-Canton Railway Corporation. Similarly, advances and equity investments from the Capital Investment Fund are excluded as they do not reflect the actual consumption of resources by the Government. |
| Note 2 |
The GDP figure used with the original estimate put out last year was based on the old GDP series. In the revised estimate here, the new GDP series incorporating technical revision, which was released in August last year, is used. In absolute terms, the new GDP series is slightly higher than the old series.
|
| Note 3 |
Over the period 2003-2007, the forecast of trend real growth in GDP is 3% per annum, and, with the forecast of trend rate of change in the GDP deflator at 0% per annum, the forecast trend nominal growth in GDP is also 3%. |
| Note
4 |
The growth rates refer to year on year change. For example, the rates for 2002-03 refer to the change between revised estimate for 2002-03 and actual expenditure in 2001-02. The rates for 2003-04 refer to the change between the 2003-04 forecast over 2002-03 revised estimate and so forth. The growth rates in 2003-04 are calculated after realignment of the underlying expenditure figures for 2002-03 and 2003-04 to reflect the reclassification of expenditure of the Lotteries Fund from that of public bodies to government expenditure from 2003-04. |
|
|
|
|
| 13
Table 5 shows the sum to be appropriated in the 2003 Budget analysed between operating and capital expenditure and after including expenditure from the Funds and other public bodies. It also shows the derivation of public expenditure for 2003-04 given in Table 4. |
|
| 14 Table 5 also illustrates the effect of the Budget revenue measures on the overall surplus/deficit position for 2003-04. |
|
Relationship between Government Expenditure
and Public Expenditure in 2003-04 |
Table 5 |
| Components of expenditure and revenue |
Appropriation |
Government
expenditure and revenue |
Public Expenditure |
| Operating |
Capital |
Total |
| |
$m |
$m |
$m |
$m |
$m |
Expenditure
General Revenue Account: |
|
|
|
|
|
|
207,840 |
207,840 |
- |
207,840 |
207,840 |
|
|
|
|
|
|
|
1,060 |
- |
1,060 |
1,060 |
1,060 |
|
6,620 |
6,620 |
- |
6,620 |
6,620 |
|
940 |
- |
940 |
940 |
940 |
| |
216,460 |
214,460 |
2,000 |
216,460 |
216,460 |
|
63,010 |
- |
- |
- |
- |
| Capital Works Reserve Fund |
- |
- |
36,200 |
36,200 |
36,200 |
| Loan Fund |
- |
- |
3,420 |
3,420 |
3,420 |
| Innovation and Technology Fund |
- |
- |
520 |
520 |
520 |
| Trading
Funds |
- |
- |
- |
- |
3,380 |
| Lotteries Fund |
- |
- |
1,080 |
1,080 |
1,080 |
| Housing Authority |
- |
- |
- |
- |
26,370 |
| |
279,470 |
214,460 |
43,220 |
257,680 |
287,430 |
| Less : Assumed salary
reduction |
- |
(860) |
- |
(860) |
(910) |
| |
279,470 |
213,600 |
43,220 |
256,820 |
286,520 |
| Revenue (before Budget revenue measures) |
|
|
|
|
|
| General Revenue Account: |
|
|
|
|
|
|
|
114,490 |
1,510 |
116,000 |
|
|
|
33,420 |
1,240 |
34,660 |
|
| |
|
147,910 |
2,750 |
150,660 |
|
| Sale
of assets |
|
- |
21,000 |
21,000 |
|
| Land Fund |
|
6,270 |
- |
6,270 |
|
| |
|
154,180 |
23,750 |
177,930 |
|
| Capital Works Reserve Fund |
|
- |
3,050 |
3,050 |
|
| Capital Investment Fund |
|
- |
2,330 |
2,330 |
|
| Civil Service Pension Reserve Fund |
|
- |
590 |
590 |
|
| Disaster Relief Fund |
|
- |
- |
- |
|
| Loan Fund |
|
- |
2,690 |
2,690 |
|
| Innovation and Technology Fund |
|
- |
100 |
100 |
|
| Lotteries Fund |
|
- |
840 |
840 |
|
| |
|
154,180 |
33,350 |
187,530 |
|
| Surplus/(deficit) before
Budget revenue
measures |
|
(59,420) |
(9,870) |
(69,290) |
|
| Less: |
Effect of Budget revenue measures |
|
6,000 |
- |
6,000 |
|
| Surplus/(deficit) after Budget revenue
measures |
|
(53,420) |
(9,870) |
(63,290) |
|
| Less: |
Advances and equity investments from the Capital Investment
Fund(1) |
|
- |
(4,580) |
(4,580) |
|
| Consolidated surplus/(deficit) |
|
(53,420) |
(14,450) |
(67,870) |
|
| (1) |
Advances and equity investments from the Capital Investment
Fund are excluded from government expenditure (see also Note 1 to Table
4).
|
|
| SECTION IV - ESTIMATES OF CONTINGENT LIABILITIES
|
| 15 The Government's contingent liabilities are $17,089 million at 31 March 2002 and estimated to be $16,436 million at 31 March 2003 and $20,134 million at 31 March 2004, comprising
- |
|
|
2001-02
|
Estimate
2002-03 |
Estimate
2003-04 |
|
$m |
$m |
$m |
| Guarantee to the Hong Kong Export
Credit Insurance Corporation for liabilities under contracts of insurance |
9,016 |
8,962 |
9,043 |
| Litigation |
4,256 |
4,230 |
4,268 |
| Possible capital subscriptions to the Asian
Development Bank |
1,743 |
1,743 |
1,743 |
| Guarantees provided under the SME Business Installations and Equipment Loan Guarantee Scheme, the Special Finance Scheme for Small and Medium Enterprises and the Film Guarantee Fund |
2,074 |
1,501 |
5,080 |
|
_________ |
________ |
________ |
| Total |
17,089 |
16,436 |
20,134 |
|
_________ |
________ |
________ |
APPENDIX B
ANALYSIS OF PUBLIC/GOVERNMENT EXPENDITURE
1998-1999 TO 2003-2004
|
CONTENTS
SECTION I - THE ESTIMATES IN
THE CONTEXT OF THE ECONOMY
Relationship between Government Expenditure,
Public Expenditure in 2003-04 and GDP
SECTION II - ANALYSIS OF
RECURRENT PUBLIC/GOVERNMENT EXPENDITURE BY POLICY AREA GROUP
Recurrent Public Expenditure - Year on Year Change
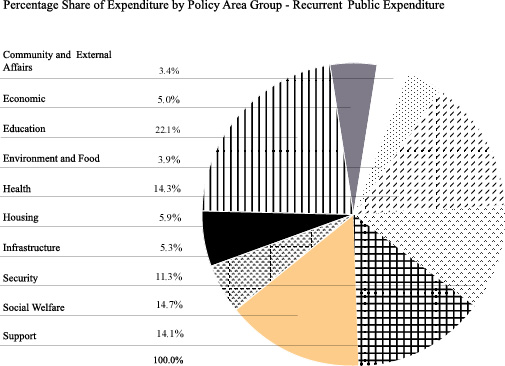
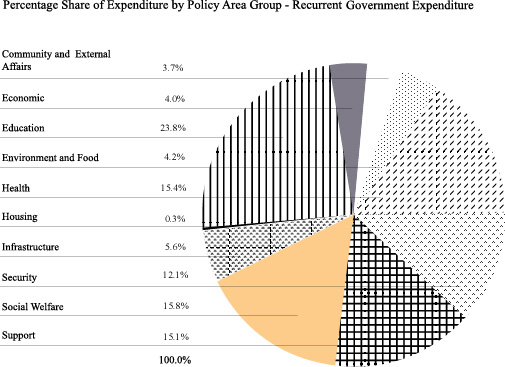
Percentage Share of Expenditure by Policy Area Group -
Recurrent Public Expenditure
Recurrent Government Expenditure
SECTION III - ANALYSIS OF
TOTAL PUBLIC/GOVERNMENT EXPENDITURE BY POLICY AREA GROUP
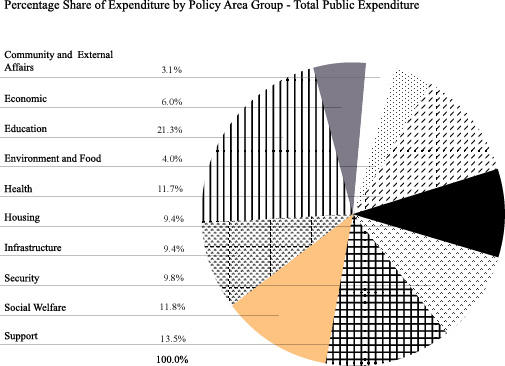
Total Public Expenditure - Year on Year Change
Percentage Share of Expenditure by Policy Area Group -
Total Public Expenditure
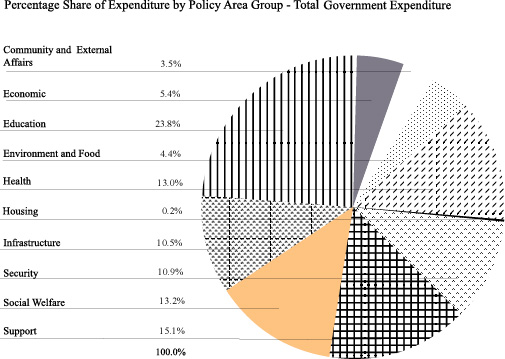
Total Government Expenditure
SECTION IV - MAJOR CAPITAL PROJECTS TO BEGIN
IN 2003-04
SECTION V - TRENDS IN PUBLIC EXPENDITURE :
1998-99 TO 2003-04
SECTION VI - KEY TO CLASSIFICATION OF EXPENDITURE
SECTION I - THE ESTIMATES(Note) IN
THE CONTEXT OF THE ECONOMY
Relationship between Government Expenditure, Public Expenditure
in 2003-04 and GDP
|
(All figures in $million at
2003-04 prices)
|
|
Government
Expenditure |
Public
Expenditure
|
| General Revenue Account |
|
|
|
|
|
|
213,600
|
213,600
|
|
|
|
|
2,000
|
2,000 |
|
________ |
________ |
|
|
|
|
215,600
|
215,600 |
|
|
|
Capital Works Reserve Fund
|
36,200 |
36,200 |
|
|
|
Loan Fund
|
3,420 |
3,420 |
|
|
|
Lotteries Fund
|
1,080 |
1,080 |
|
|
|
Innovation and Technology Fund
|
520 |
520 |
|
________ |
________ |
|
|
|
|
256,820
|
256,820 |
|
________ |
|
|
|
|
Trading Funds
|
|
3,360 |
|
|
|
Housing Authority
|
|
26,340 |
|
|
________ |
|
|
|
|
|
286,520
|
|
|
________ |
|
|
|
GDP
|
|
1,283,230
|
|
|
|
| Government Expenditure as a % of GDP |
|
20.0% |
|
|
|
| Public Expenditure as a % of GDP |
|
22.3% |
|
|
|
| Note : |
The 2003-04 expenditure estimates in this
Appendix have assumed a 3.0% reduction in the salaries of the civil
service and the salary-related portion of recurrent subventions to take
effect from 1 January 2004. |
|
|
SECTION II - ANALYSIS OF
RECURRENT PUBLIC/GOVERNMENT EXPENDITURE BY POLICY AREA GROUP
Recurrent Public Expenditure - Year on Year Change
|
(All figures in $million) |
|
2002-03 |
2002-03 |
2003-04 |
%
Increase/Decrease over 2002-03 original estimate in Nominal Terms |
% Increase/Decrease over
2002-03 revised estimate
|
|
Original
Estimate |
Revised
Estimate |
Estimate |
|
in Nominal
Terms |
in Real
Terms |
|
|
|
|
|
|
(see Note) |
Education
|
49,315 |
47,275 |
49,260 |
-0.1 |
+4.2 |
+6.3 |
Health
|
32,450 |
32,460 |
31,890 |
-1.7 |
-1.8 |
+0.2 |
Social Welfare
|
32,125 |
31,465 |
32,765 |
+2.0 |
+4.1 |
+7.5 |
Support
|
|
|
|
|
|
|
- Central Management of the Civil Service
|
18,170 |
17,945 |
21,030 |
+15.7 |
+17.2 |
+17.8 |
|
10,260 |
9,980 |
10,285 |
+0.2 |
+3.1 |
+5.0 |
|
______ |
______ |
______ |
______ |
______ |
______ |
|
|
|
|
|
|
|
|
28,430 |
27,925 |
31,315 |
+10.1 |
+12.1 |
+13.2 |
|
______ |
______ |
______ |
______ |
______ |
______ |
|
|
|
|
|
|
|
Security
|
24,810 |
24,960 |
25,015 |
+0.8 |
+0.2 |
+2.1 |
Housing
|
12,235 |
12,770 |
13,030 |
+6.5 |
+2.0 |
+3.2 |
Infrastructure
|
|
|
|
|
|
|
|
5,505 |
5,365 |
5,380 |
-2.3 |
+0.3 |
+1.9 |
- Buildings, Lands and Planning
|
3,330 |
3,195 |
3,295 |
-1.1 |
+3.1 |
+5.3 |
|
3,105 |
3,050 |
3,085 |
-0.6 |
+1.1 |
+3.2 |
|
______ |
______ |
______ |
______ |
______ |
______ |
|
|
|
|
|
|
|
|
11,940 |
11,610 |
11,760 |
-1.5 |
+1.3 |
+3.2 |
|
______ |
______ |
______ |
______ |
______ |
______ |
|
|
|
|
|
|
|
Economic
|
11,825 |
11,025 |
11,135 |
-5.8 |
+1.0 |
+3.0 |
Environment and Food
|
9,005 |
8,610 |
8,760 |
-2.7 |
+1.7 |
+3.4 |
| Community and External Affairs |
|
|
|
|
|
|
|
|
|
|
|
|
|
|
5,660 |
5,650 |
5,710 |
+0.9 |
+1.1 |
+2.7 |
|
1,910 |
1,890 |
1,860 |
-2.6 |
-1.6 |
+0.3 |
|
______ |
______ |
______ |
______ |
______ |
______ |
|
|
|
|
|
|
|
|
7,570 |
7,540 |
7,570 |
0 |
+0.4 |
+2.1 |
|
______ |
______ |
______ |
______ |
______ |
______ |
|
|
|
|
|
|
|
| Total Recurrent Public Expenditure |
219,705 |
215,640 |
222,500 |
+1.3 |
+3.2 |
+5.2 |
|
_______ |
_______ |
_______ |
_______ |
_______ |
_______ |
|
|
|
|
|
|
|
|
|
|
|
|
|
|
| Note : |
As the above 2003-04 estimates
have included assumptions on price changes for various expenditure components (e.g. operating expenses, plant and equipment, etc.) and an assumed reduction of 3% in salaries for the civil service and
the salary-related portion of recurrent subventions from 1 January 2004, the
percentage increase/decrease is calculated after adjustment to bring the expenditure figures for 2002-03 and 2003-04 to the same price level.
|
SECTION III - ANALYSIS OF
TOTAL PUBLIC/GOVERNMENT EXPENDITURE BY POLICY AREA GROUP
Total Public Expenditure -
Year on Year Change
|
(All figures in $million) |
|
2002-03 |
2002-03 |
2003-04 |
%
Increase/Decrease over 2002-03 original estimate in Nominal Terms |
%
Increase/Decrease over 2002-03 revised estimate |
|
Original
Estimate |
Revised
Estimate |
Estimate |
|
in Nominal
Terms |
in Real
Terms |
|
(see Note 1) |
|
|
|
|
(see Note 2) |
Education
|
59,395 |
54,890 |
61,025 |
+2.7 |
+11.2 |
+13.8 |
Support
|
|
|
|
|
|
|
|
16,870 |
16,070 |
16,400 |
-2.8 |
+2.1 |
+5.1 |
- Central Management of the Civil Service
|
19,580 |
18,900 |
22,345 |
+14.1 |
+18.2 |
+18.8 |
|
______ |
______ |
______ |
______ |
______ |
______ |
|
|
|
|
|
|
|
|
36,450 |
34,970 |
38,745 |
+6.3 |
+10.8 |
+12.5 |
|
______ |
______ |
______ |
______ |
______ |
______ |
|
|
|
|
|
|
|
Health
|
34,410 |
33,900 |
33,405 |
-2.9 |
-1.5 |
+0.7 |
Social Welfare
|
33,740 |
32,560 |
33,975 |
+0.7 |
+4.3 |
+7.8 |
Housing
|
28,735 |
29,050 |
26,940 |
-6.2 |
-7.3 |
-4.3 |
Security
|
28,600 |
27,860 |
27,915 |
-2.4 |
+0.2 |
+2.2 |
Infrastructure
|
|
|
|
|
|
|
- Buildings, Lands and Planning
|
10,590 |
9,545 |
10,880 |
+2.7 |
+14.0 |
+19.3 |
|
7,435 |
7,440 |
6,715 |
-9.7 |
-9.7 |
-7.6 |
|
7,365 |
7,995 |
9,495 |
+28.9 |
+18.8 |
+24.0 |
|
______ |
______ |
______ |
______ |
______ |
______ |
|
|
|
|
|
|
|
|
25,390 |
24,980 |
27,090 |
+6.7 |
+8.4 |
+12.8 |
|
______ |
______ |
______ |
______ |
______ |
______ |
|
|
|
|
|
|
|
Economic
|
19,140 |
14,710 |
17,115 |
-10.6 |
+16.4 |
+19.0 |
Environment and Food
|
12,480 |
11,635 |
11,350 |
-9.1 |
-2.4 |
-0.2 |
| Community and External Affairs |
|
|
|
|
|
|
|
|
|
|
|
|
|
- Recreation, Culture and Amenities
|
6,470 |
6,335 |
6,750 |
+4.3 |
+6.6 |
+8.9 |
- District and Community Relations
|
2,370 |
2,165 |
2,205 |
-7.0 |
+1.8 |
+4.2 |
|
______ |
______ |
______ |
______ |
______ |
______ |
|
|
|
|
|
|
|
|
8,840 |
8,500 |
8,955 |
+1.3 |
+5.4 |
+7.7 |
|
______ |
______ |
______ |
______ |
______ |
______ |
|
|
|
|
|
|
|
| Total Public Expenditure |
287,180 |
273,055 |
286,515 |
-0.2 |
+4.9 |
+7.6 |
|
_______ |
_______ |
_______ |
_______ |
_______ |
_______ |
|
|
|
|
|
|
|
| Note 1 |
Certain figures have been reclassified to be consistent with the classification for 2002-03 Revised Estimate and 2003-04 Estimate.
|
| Note 2 |
As the above 2003-04 estimates have included assumptions on price changes for various expenditure components (e.g. operating expenses, plant and equipment, etc.) and an assumed reduction of 3% in salaries for the civil service and
the salary-related portion of recurrent subventions from 1 January 2004, the
percentage increase/decrease is calculated after adjustment to bring the expenditure figures for 2002-03 and 2003-04 to the same price level.
|
SECTION IV - MAJOR CAPITAL PROJECTS TO BEGIN
IN 2003-04
Funds
allocated for capital projects to start in 2003-04 include :
|
$million
|
|
|
| Infrastructure |
_____26,921 |
|
Deep Bay Link |
|
|
Shenzhen Western Corridor |
|
|
Reconstruction and improvement of
Tuen Mun Road |
|
|
South East Kowloon development related works |
|
|
Wan Chai development phase II
- engineering works |
|
|
Replacement and rehabilitation of watermains, stage I phase I |
|
|
|
|
| Support |
______6,400 |
|
Central Government Complex, Legislative Council Complex, exhibition gallery
and civic place at Tamar, Central |
|
|
|
|
Education |
______5,365 |
|
Construction of additional primary, secondary
and special schools |
|
|
School Improvement Programme, Final Phase
- remaining works |
|
|
|
|
Security |
______3,916 |
|
Construction of cross-boundary facilities at Shenzhen Western Corridor
and Huanggang |
|
|
Reprovisioning of Civil Aid Service and Fire Services Department facilities
at Site 17, West Kowloon Reclamation, Yau Ma Tei |
|
|
|
|
| Health |
______2,507 |
|
Redevelopment of Caritas Medical Centre, phase 2 |
|
|
Redevelopment of staff quarters for the establishment of a rehabilitation block
at Tuen Mun Hospital |
|
|
|
|
| Economic |
_______ 1,868 |
|
New Broadcasting House in Area 86, Tseung Kwan O |
|
|
Enhancement of tourism facilities |
|
|
|
|
| Environment and Food |
_______1,121 |
|
Environmental improvement of
Shing Mun River珦tage 2 |
|
|
General improvements works to and retro-fitting of air-conditioning in existing
markets and cooked food centres |
|
|
Outlying Islands sewerage, stage 1 phase 1 part 1 |
|
|
|
|
| Community and External
Affairs |
_______1,049 |
|
Hammer Hill Road Park and other open spaces |
|
|
Stanley Complex |
|
|
Recreation and sport facilities in
Tseung Kwan O and Tin Shui Wai |
|
|
|
|
SECTION V - TRENDS IN
PUBLIC EXPENDITURE : 1998-99 TO 2003-04
Introduction
The section presents trends in public expenditure over the period 1998-99 to 2003-04. This analysis is expressed in public expenditure terms and includes expenditure by the Trading Funds, the Housing Authority, the Lotteries Fund and the previous Provisional Urban Council and Provisional Regional Council (up to 31 December 1999). It shows the actual and estimated recurrent and total expenditure during this period and expresses this in terms of 10 main policy area groups. Where appropriate, policy area groups are further analysed by policy areas.
2 Details of the individual heads of expenditure contributing to a particular policy area are provided in an index in Volume I of the 2003-04 Estimates. This index further provides details by head of expenditure of individual programmes which contribute to a policy area.
3
The analysis provided in this section shows how resources have been and will, in 2003-04, be allocated to different policy area groups. Where appropriate, historical figures have been adjusted to comply with the current classification of expenditure.
Recurrent Public Expenditure by Policy Area Group
1998-99 to 2003-04 |
| Policy Area Groups |
Actual |
Revised Estimate |
Estimate |
| 1998-99 |
1999-2000 |
2000-01 |
2001-02 |
2002-03 |
2003-04 |
| % |
% |
% |
% |
% |
% |
| Education |
21.8 |
22.0 |
22.3 |
22.0 |
21.9 |
22.1 |
| Health |
15.3 |
15.3 |
15.4 |
15.2 |
15.0 |
14.3 |
| Social Welfare |
13.5 |
13.7 |
13.8 |
13.8 |
14.6 |
14.7 |
| Support |
11.9 |
12.2 |
12.7 |
13.7 |
13.0 |
14.1 |
| Security |
|
|
|
|
|
|
|
9.7 |
9.4 |
9.3 |
9.0 |
8.9 |
8.6 |
|
1.7 |
1.8 |
1.6 |
1.6 |
1.6 |
1.6 |
|
1.1 |
1.1 |
1.1 |
1.1 |
1.1 |
1.1 |
|
12.5 |
12.3 |
12.0 |
11.7 |
11.6 |
11.3 |
| Housing |
6.3 |
6.0 |
5.8 |
5.8 |
5.9 |
5.9 |
| Economic |
5.4 |
5.2 |
5.2 |
5.1 |
5.1 |
5.0 |
| Infrastructure |
|
|
|
|
|
|
|
2.6 |
2.6 |
2.6 |
2.5 |
2.5 |
2.4 |
Buildings, Lands and Planning
|
1.4 |
1.4 |
1.4 |
1.5 |
1.5 |
1.5 |
|
1.4 |
1.5 |
1.4 |
1.4 |
1.4 |
1.4 |
|
5.4 |
5.5 |
5.4 |
5.4 |
5.4 |
5.3 |
| Environment and Food |
4.2 |
4.2 |
4.0 |
3.9 |
4.0 |
3.9 |
| Community and External Affairs |
|
|
|
|
|
|
Recreation, Culture and Amenities
|
2.9 |
2.8 |
2.6 |
2.6 |
2.6 |
2.6 |
|
0.8 |
0.8 |
0.8 |
0.8 |
0.9 |
0.8 |
|
3.7 |
3.6 |
3.4 |
3.4 |
3.5 |
3.4 |
|
100.0 |
100.0 |
100.0 |
100.0 |
100.0 |
100.0 |
| Total Recurrent Public Expenditure |
$m |
$m |
$m |
$m |
$m |
$m |
| 187,857 |
195,272 |
198,619 |
210,445 |
215,640 |
222,500 |
| Total Public Expenditure by Policy Area Group
1998-99
to 2003-04 |
| Policy Area Groups |
Actual |
Revised Estimate |
Estimate |
| 1998-99 |
1999-2000 |
2000-01 |
2001-02 |
2002-03 |
2003-04 |
| % |
% |
% |
% |
% |
% |
| Education |
18.2 |
18.7 |
19.2 |
19.4 |
20.1 |
21.3 |
| Support |
11.1 |
11.6 |
11.6 |
13.0 |
12.8 |
13.5 |
| Health |
11.8 |
11.8 |
12.2 |
12.7 |
12.4 |
11.7 |
| Social Welfare |
9.9 |
10.2 |
10.5 |
11.2 |
11.9 |
11.8 |
| Housing |
14.6 |
17.0 |
15.9 |
11.9 |
10.6 |
9.4 |
| Security |
|
|
|
|
|
|
|
7.3 |
7.5 |
7.8 |
8.0 |
7.9 |
7.4 |
|
1.3 |
1.3 |
1.4 |
1.3 |
1.3 |
1.3 |
|
0.8 |
0.8 |
0.8 |
0.9 |
1.0 |
1.1
|
|
9.4 |
9.6 |
10.0 |
10.2 |
10.2 |
9.8 |
| Infrastructure |
|
|
|
|
|
|
Buildings, Lands and Planning
|
3.1 |
3.0 |
3.2 |
4.0 |
3.5 |
3.8 |
|
3.1 |
3.1 |
3.0 |
2.9 |
2.7 |
2.3 |
|
2.5 |
2.4 |
2.4 |
2.4 |
3.0 |
3.3 |
|
8.7 |
8.5 |
8.6 |
9.3 |
9.2 |
9.4 |
| Economic |
8.0 |
4.6 |
4.7 |
5.1 |
5.4 |
6.0 |
| Environment and Food |
5.0 |
4.6 |
4.2 |
4.1 |
4.3 |
4.0 |
| Community and External Affairs |
|
|
|
|
|
|
Recreation, Culture and Amenities
|
2.7 |
2.8 |
2.4 |
2.4 |
2.3 |
2.3 |
|
0.6 |
0.6 |
0.7 |
0.7 |
0.8 |
0.8 |
|
3.3 |
3.4 |
3.1 |
3.1 |
3.1 |
3.1 |
|
100.0 |
100.0 |
100.0 |
100.0 |
100.0 |
100.0 |
| Total Public Expenditure |
$m |
$m |
$m |
$m |
$m |
$m |
| 266,448 |
269,484 |
267,507 |
269,359 |
273,055 |
286,515 |
| Policy Area Group |
Description by Policy Area |
Reference
(Note) |
Community and
External Affairs |
District and Community Relations |
19 |
|
| Recreation, Culture, Amenities and Entertainment Licensing |
18 |
|
|
|
|
|
| Economic |
Air and Sea Communications and Logistics Development |
3 |
|
|
Commerce and Industry |
6 |
|
|
Employment and
Labour |
8 |
|
|
Financial Services |
1 |
|
|
Information
Technology and Broadcasting |
17 |
|
|
Manpower
Development |
34 |
|
|
Posts, Power, Competition
Policy and Consumer Protection |
4 |
|
|
Public Safety |
7 |
|
|
Travel and Tourism |
5 |
|
|
|
|
|
| Education |
Education |
16 |
|
|
|
|
|
| Environment and Food |
Environmental Hygiene |
32 |
|
|
Environmental Protection and Conservation |
23 |
|
|
Agriculture, Fisheries and
Food Safety |
2 |
|
|
|
|
|
| Health |
Health |
15 |
|
|
|
|
|
| Housing |
Housing |
31 |
|
|
|
|
|
| Infrastructure |
Buildings, Lands and Planning |
22 |
|
|
Transport |
21 |
|
|
Water Supply |
24 |
|
|
|
|
|
| Security |
Immigration Control |
10 |
|
|
Internal Security |
9 |
|
|
Administration of Justice |
12 |
|
|
Anti-Corruption |
13 |
|
|
Legal Administration |
11 |
|
|
Legal Aid |
20 |
|
|
|
|
|
| Social Welfare |
Social Welfare |
14 |
|
|
Women's Interest |
33 |
|
|
|
|
|
| Support |
Central Management of the Civil Service |
26 |
|
|
Complaints Against Maladministration |
30 |
|
|
Constitutional Affairs |
28 |
|
|
Intra-governmental Services |
27 |
|
|
Revenue Collection and Financial Control |
25 |
|
|
Support for Members of the Legislative Council |
29 |
|
|
|
|
|
| Note: |
The Policy Area Reference corresponds with that used in the Index of
Policy Areas in the Estimates of Expenditure. |
|
|
APPENDIX C
GLOSSARY OF TERMS
Note: Terms shown in bold italic are defined elsewhere in the glossary.
|
Capital expenditure.
All expenditure charged to the Capital Works Reserve Fund, the Disaster Relief Fund, the Loan Fund, the Innovation and Technology Fund and the Lotteries Fund plus expenditure from General Revenue Account on plant, equipment and works and capital subventions, excluding transfers to Funds. It does not include advances and equity investments made from the Capital Investment Fund.
Capital revenue.
Consolidated surplus/deficit.
Fiscal reserves.
Funds expenditure.
Expenditure charged to the Capital Works Reserve Fund, the Capital Investment Fund, the Disaster Relief Fund, the Loan Fund, the Innovation and Technology Fund and Lotteries Fund excluding transfers from the Funds..
Funds revenue.
All receipts, except transfers from General Revenue Account, which are
credited directly to the Funds. These comprise -
Capital Investment Fund
repayments received
dividends
interest
interest on balances
Capital Works Reserve Fund
donations for projects
land premia
investment income
recovery from MTR Corporation Ltd
recoveries from Trading Funds
Civil Service Pension Reserve Fund
investment income
Disaster Relief Fund
investment income
Innovation and Technology Fund
loan repayments received
investment income
Land Fund
investment income
Loan Fund
loan repayments received
interest on loans
interest on balances
Lotteries Fund
loan repayments received
share of proceeds from the Mark Six Lottery
investment income
General Revenue Account expenditure.
All expenditure charged to General Revenue Account in accordance with
the Appropriation Ordinance, excluding transfers to the Funds.
General Revenue Account revenue.
All receipts credited to any of the revenue heads, excluding transfers
from the Funds.
Government expenditure.
The aggregate of operating expenditure and capital
expenditure. It is not the same as public expenditure.
Government revenue.
The aggregate of Funds revenue and General Revenue
Account revenue.
Operating expenditure.
All expenditure from General Revenue Account charged to any of the
subheads listed in the Estimates under 'Recurrent Account', plus Other Non-Recurrent expenditure.
Operating surplus/deficit.
The difference between operating revenue and operating expenditure.
Public expenditure.
Government expenditure plus expenditure (recurrent and capital) by the Trading Funds
and the Housing Authority.
Operating revenue.
This comprises all receipts to be credited to General Revenue
Account under any of the following revenue heads, namely -
Duties
General Rates
Internal Revenue
Motor Vehicle Taxes
Fines, Forfeitures and Penalties
Royalties and Concessions
Properties and Investments
Loans, Reimbursements, Contributions and Other Receipts (excluding
transfers from Funds)
Utilities
Fees and Charges
except the following -
disposal proceeds of government quarters and other assets
estate duty
taxi concessions
recovery from Housing Authority
donations
repayment of loans and advances
which are treated as capital revenue.
Total expenditure.
The aggregate of government expenditure and advances and equity investments made from the Capital Investment Fund.
Surplus/deficit.
The difference between Government revenue and Total expenditure.
|
|
|