| (All figures in $million) | |||
| 1999-2000 Revised Estimate |
2000-01 Draft Estimate |
%
Increase in Real Terms |
|
| Community and External Affairs | |||
|
1,565 | 1,645 | + 5.3 |
|
5,915 __________ |
5,710 __________ |
-
3.4 __________ |
| |
7,480 __________ |
7,355 __________ |
-
1.6 __________ |
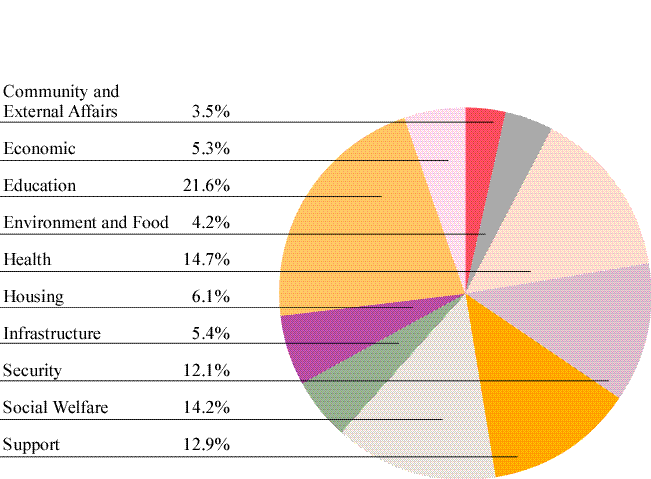
| Economic | 10,605 | 11,060 | + 3.9 |
| Education | 43,360 | 45,175 | + 4.2 |
| Environment and Food | 8,455 | 8,635 | + 2.2 |
| Health | 30,020 | 30,790 | + 2.8 |
| Housing | 12,885 | 12,845 | - 0.3 |
| Infrastructure | |||
|
2,775 | 2,920 | + 5.3 |
|
2,910 | 2,970 | + 2.1 |
|
5,220 ________ |
5,430 ________ |
+
4.0 ________ |
| |
10,905 ________ |
11,320 ________ |
+
3.8 ________ |
| Security | 24,305 | 25,210 | + 3.8 |
| Social Welfare | 27,260 | 29,755 | + 9.2 |
| Support |
24,395 ________ |
26,950 ________ |
+ 10.7 ________ |
| Total
Recurrent Expenditure |
199,670 ________ |
209,095 ________ |
+
4.8 ________ |
Analysis of Recurrent Public Expenditure by Policy Area Group 2000-01
Analysis of Recurrent Government Expenditure by Policy Area Group 2000-01
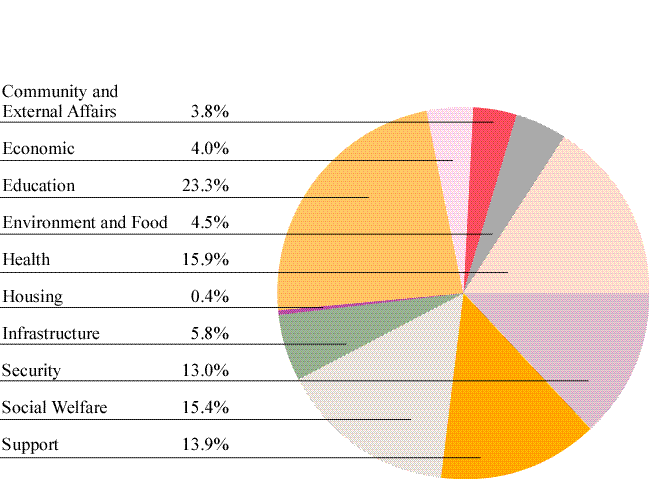
| Note : | This chart provides an analysis of government spending only, i.e. it
excludes expenditure of the Trading Funds, the Lotteries Fund and the Housing Authority. |