APPENDICES |
| A. Medium Range Forecast
2000-2001 to 2004-2005 Forecasting Government's expenditure and revenue in the period up to 2004-2005 and setting these forecasts in a historical context. B. Trends in public expenditure 1996-1997 to 2001-2002 Showing the allocation of resources between policy area groups. C. Growth in recurrent
public expenditure in 2001-2002 in major policy Listing major improvements in services in 2001-2002. D. Major capital projects to begin in 2001-2002 Listing major capital projects to begin in 2001-2002. |
APPENDIX A MEDIUM RANGE FORECAST 2000-2001 TO 2004-2005
|
||||||||||||||||||||||||||||||||||||||||||||||||||||||||||||||||||||||||||||||||||||||||||||||||||||||||||||||||||||||||||||||||||||||||||||||||||||||||||||||||||||||||||||||||||||||||||||||||||||||||||||||||||||||||||||||||||||||||||||||||||||||||||||
| INTRODUCTION The Medium Range Forecast (MRF) is a projection of expenditure and revenue for the forecast period based on the forecasting assumptions and budgetary criteria outlined in Section I of this Appendix. 2 The MRF is presented in three sections: (I) Forecasting assumptions and budgetary criteria. (II) The MRF for 2000-2001 to 2004-2005. (III) Commentary on the MRF in relation to budgetary criteria. 3 An estimate of Government's contingent liabilities at 31 March 2001 and 31 March 2002 respectively is provided in Section IV of this Appendix as supplementary information to the MRF. SECTION I - FORECASTING ASSUMPTIONS AND BUDGETARY CRITERIA 4 A number of computer based models are used to derive the MRF. These models reflect a wide range of assumptions about the factors determining each of the components of Government's revenue and expenditure. Some are economic in nature (the general economic assumptions) while others deal with specific areas of Government's activity (the detailed assumptions). These are supported by studies of historical and anticipated trends. General Economic Assumptions Growth in Gross Domestic Product (GDP) 5 There is a clear link between many of Government's major revenue sources and economic growth. For planning purposes the medium range assumption as to annual GDP growth for the current MRF has been set at 4% in real terms. Inflation 6 Over the forecast period the average year on year inflation is assumed to be 2.5%. It is emphasised that this is a trend assumption related to the GDP deflator. Methodology 7 In arriving at the yearly forecasts, account is taken of short-term fluctuations from the trend forecasts. Detailed Assumptions 8 A wide range of detailed assumptions relating to developing expenditure and revenue patterns over the forecast period are taken into account. These include:
Budgetary Criteria 9 In addition to the above forecasting assumptions there are a number of criteria against which the results of forecasts are tested for overall acceptability in terms of budgetary policy. Any significant breach of these parameters results in a review of the underlying programmes and adjustments where necessary and appropriate. 10 The following are the more important budgetary criteria:
SECTION II - THE MRF FOR 2000-2001 TO 2004-2005 11 The current MRF is summarised in the following three tables which indicate the forecast operating position, capital cash flow and consolidated reserves (Note a).
Notes on the Medium Range Forecast (a) Accounting policies
(b) General Revenue Account - Revenue This comprises all receipts to be credited to any of the following revenue heads, namely - Duties For the purpose of the Medium Range Forecast:
(c) General Revenue Account - Expenditure This comprises all expenditure to be charged to the General Revenue Account in accordance with the Appropriation Ordinance, with the exception of the transfers to Funds. It includes the day to day operational expenses of government departments together with minor capital purchases of a routine nature. (d) Operating surplus/deficit for the year The deficits in 2000-2001 to 2003-2004 are after provision for compensatory payments and commuted pension gratuity payments under the Voluntary Retirement Scheme and the Voluntary Departure Scheme introduced in 2000-2001. These payments are one-off in nature and forecast to amount to $1.3 billion in 2000-2001, $5.7 billion in 2001-2002, $2.6 billion in 2002-2003 and $0.6 billion in 2003-2004. (e) Funds - Revenue This comprises all revenue receivable by the Funds except the transfers from General Revenue Account. It includes - Land premia The breakdown of revenue to the various Funds is -
(f) Transfers between General Revenue Account and the Funds The transfers between General Revenue Account and the Funds are assessed with regard to the commitments of the Funds and their forecast cash flow requirements. The breakdown of the transfers for 2000-2001 and 2001-2002 is -
|
||||||||||||||||||||||||||||||||||||||||||||||||||||||||||||||||||||||||||||||||||||||||||||||||||||||||||||||||||||||||||||||||||||||||||||||||||||||||||||||||||||||||||||||||||||||||||||||||||||||||||||||||||||||||||||||||||||||||||||||||||||||||||||
(g) Expenditure on capital projects
This comprises expenditure chargeable to the Capital Works Reserve Fund in respect of the Public Works Programme, land acquisition, capital subventions, major systems and equipment and computerisation.
(h) Loans
These comprise loans made from the Loan Fund, including loans to schools, teachers, students, housing loans, and loans under the special finance scheme for small and medium enterprises.
The forecast of payments from the Loan Fund is -
| 2000-2001 | 2001-2002 | 2002-2003 | 2003-2004 | 2004-2005 |
| $m | $m | $m | $m | $m |
| 5,840 | 9,420 | 10,200 | 7,840 | 6,030 |
(i) Investments
These comprise, in the main, advances and equity investments made from the Capital Investment Fund to Trading Funds and statutory bodies.
The forecast of payments from the Capital Investment Fund is -
| 2000-2001 | 2001-2002 | 2002-2003 | 2003-2004 | 2004-2005 |
| $m | $m | $m | $m | $m |
| 8,110 | 2,000 | 2,660 | 9,910 | 6,220 |
(j) Aid for disaster relief
This is actual expenditure made from the Disaster Relief Fund for providing relief to disasters that occur outside Hong Kong. Because of the unpredictable nature of disasters, no estimate of future expenditure is made for the forecast period.
(k) Expenditure for Innovation and Technology
This comprises expenditure chargeable to the Innovation and Technology Fund to finance projects to help promote innovation and technology upgrading in manufacturing and service industries.
(l) Fiscal reserves
The fiscal reserves represent the accumulated balances of the General Revenue Account (including the Land Fund) and the Funds. The movement in the fiscal reserves from one year to the next year represents the estimated surplus/deficit for the year.
SECTION III - COMMENTARY ON THE MRF
Expenditure Growth
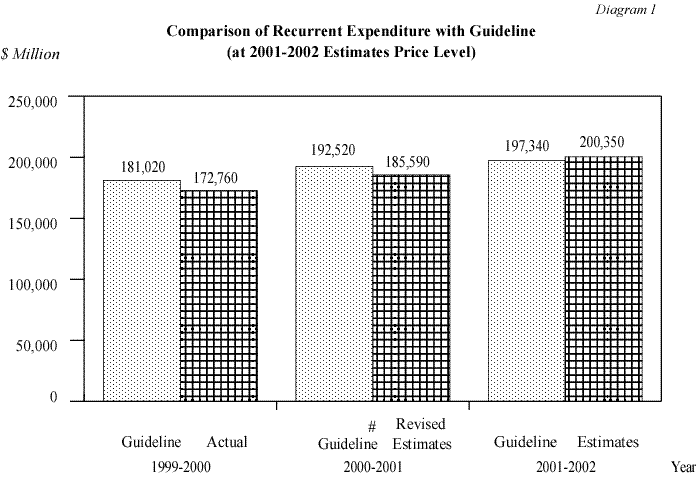
12 To demonstrate that expenditure growth, over time, does not exceed the trend growth rate in the economy, Government's spending plans should be compared with the budgetary guidelines (Diagrams 1 and 2).

| # | The guidelines in 2000-2001 have been restructured to allow for real growth of 2.5% in recurrent expenditure and 3% in capital works expenditure in 2000-2001 over the original estimate for 1999-2000 and to take into account the impact of the reorganisation of municipal services. |
Public Expenditure in the Context of the Economy
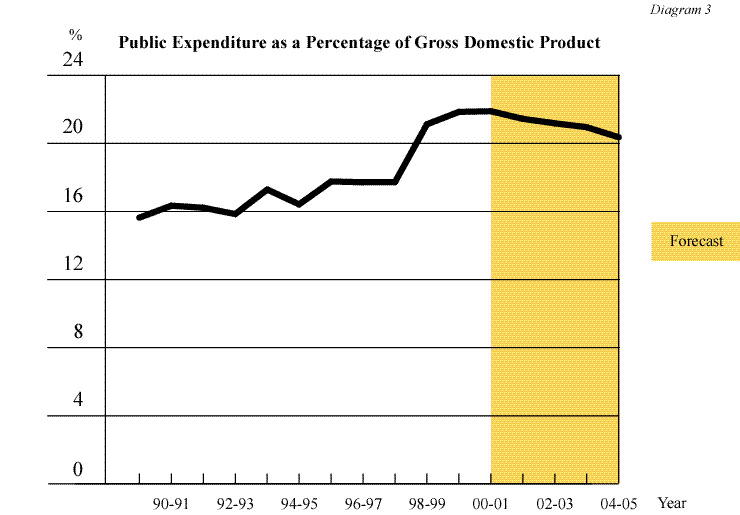
13 For monitoring purposes, the Government's own expenditure is consolidated with the expenditure of some other public bodies such as the Housing Authority in order to compare total public expenditure with the size of the economy.
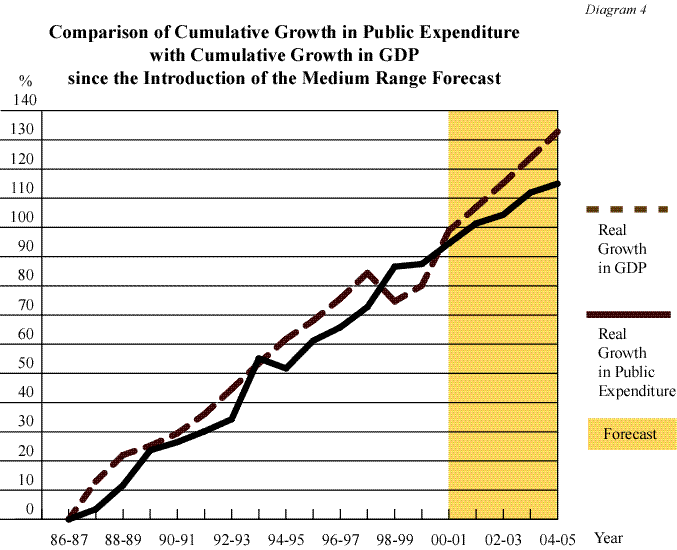
14 The results of this comparison are set out in Table 4 and the historical and forecast relationship between GDP and public expenditure is illustrated in Diagram 3. A comparison of cumulative growth in public expenditure with cumulative growth in GDP since the introduction of the MRF in 1986-87 is shown in Diagram 4. GDP figures quoted in Table 4 and used to derive Diagrams 3 and 4 are based on trend forecasts for 2001–2002 onwards.
| Public Expenditure in the Context of the Economy (Note 1) | Table 4 |
| Revised Estimate | Forecast | ||||
| 2000-2001 | 2001-2002 | 2002-2003 | 2003-2004 | 2004-2005 | |
| $m | $m | $m | $m | $m | |
| Operating expenditure | 188,800 | 207,830 | 220,040 | 233,470 | 249,570 |
| Capital expenditure | 37,300 | 44,840 | 46,810 | 49,290 | 47,900 |
| Total government expenditure | 226,100 | 252,670 | 266,850 | 282,760 | 297,470 |
| Add: Other public bodies | 52,290 | 38,000 | 35,700 | 38,600 | 36,920 |
| Total public expenditure | 278,390 | 290,670 | 302,550 | 321,360 | 334,390 |
| Gross Domestic Product (calendar year) (Note 2) |
1,271,700 | 1,355,630 | 1,445,100 | 1,540,480 | 1,642,150 |
| Growth in GDP | |||||
Money terms |
3.1% | 6.6% | 6.6% | 6.6% | 6.6% |
Real terms |
10.5% | 4.0% | 4.0% | 4.0% | 4.0% |
| Growth in public expenditure | |||||
Money terms |
+3.3% | +4.4% | +4.1% | +6.2% | +4.1% |
Real terms |
+3.8% | +3.5% | +1.5% | +3.7% | +1.4% |
| Public expenditure as a percentage of GDP (at current prices)(Note 3) |
21.9% | 21.4% | 20.9% | 20.9% | 20.4% |
| Note 1 | Public expenditure comprises government expenditure (i.e. all expenditure charged to the General Revenue Account and financed by the Government's statutory Funds excluding Capital Investment Fund), and expenditure by the Trading Funds, the Housing Authority and the Lotteries Fund. Expenditure by institutions in the private or quasi-private sector is included to the extent of their subventions. But not included is expenditure by those organisations, including statutory organisations, in which the Government has only an equity position, such as the Airport Authority, the MTR Corp Ltd and the Kowloon-Canton Railway Corporation. Similarly, advances and equity investments from the Capital Investment Fund are excluded as they do not reflect the actual consumption of resources by the Government. |
| Note 2 | For years beyond the current year, the GDP figures are based on trend assumptions. |
| Note 3 | Caution should be exercised in interpreting these percentages as the public expenditure is estimated on a fiscal year basis while the GDP is estimated on a calendar year basis. |
15 Table 5 shows the sum to be appropriated in the 2001-2002 Budget analysed between operating and capital expenditure and after including expenditure from the various Funds and other public bodies. It also shows the derivation of public expenditure for 2001-2002 given in Table 4.
16 Table 5 also illustrates the effect of the Budget revenue measures on the overall surplus/deficit position for 2001-2002.
| Relationship between Government Expenditure and Public Expenditure in 2001-2002 |
Table 5 |
| Components of expenditure and revenue | Appropriation | Government expenditure and revenue | Public Expenditure | |||
| Operating | Capital | Total | ||||
| $m | $m | $m | $m | $m | ||
| Expenditure General Revenue Account: |
||||||
Recurrent account |
202,985 | 202,985 | - | 202,985 | 202,985 | |
Capital account |
||||||
Plant, equipment and works |
1,695 | - | 1,695 | 1,695 | 1,695 | |
Other non-recurrent |
4,845 | 4,845 | - | 4,845 | 4,845 | |
Subventions |
1,405 | - | 1,405 | 1,405 | 1,405 | |
| 210,930 | 207,830(1) | 3,100 | 210,930 | 210,930 | ||
Transfers to Funds |
3,025 | - | - | - | - | |
| Capital Works Reserve Fund | - | - | 31,430 | 31,430 | 31,430 | |
| Load Fund | - | - | 9,420 | 9,420 | 9,420 | |
| Innovation and Technology Fund | - | - | 890 | 890 | 890 | |
| Trading funds | - | - | - | - | 3,375 | |
| Lotteries Fund | - | - | - | - | 1,010 | |
| Housing Authority | - | - | - | - | 33,610 | |
| 213,955 | 207,830 | 44,840 | 252,670 | 290,665 | ||
| Revenue (before Budget revenue measures) | ||||||
| General Revenue Account: | ||||||
Taxation |
131,900 | 1,260 | 133,160 | |||
Other revenue |
38,380 | 4,460 | 42,840 | |||
| 170,280 | 5,720 | 176,000 | ||||
| MTR Privatisation proceeds | - | 15,000 | 15,000 | |||
| Land Fund (2) | 21,020 | - | 21,020 | |||
| 191,300 | 20,720 | 212,020 | ||||
| Capital Works Reserve Fund | - | 30,310 | 30,310 | |||
| Capital Investment Fund | - | 2,770 | 2,770 | |||
| Civil Service Pension Reserve Fund | - | 1,000 | 1,000 | |||
| Disaster Relief Fund | - | - | - | |||
| Load Fund | - | 5,230 | 5,230 | |||
| Innovation and Technology Fund | - | 400 | 400 | |||
| 191,300 | 60,430 | 251,730 | ||||
| Cash surplus/(deficit) before Budget revenue measures | (16,530) | 15,590 | (940) | |||
| Less: | Effect of Budget revenue measures | (30) | - | (30) | ||
| Cash surplus/(deficit) after Budget revenue measures | (16,560) | 15,590 | (970) | |||
| Less: | Advances and equity investments from the Capital Investment Fund(3) | - | (2,000) | (2,000) | ||
| Consolidated Deficit | (16,560)(1) | 13,590 | (2,970) | |||
| (1) | The consolidated operating deficit is after the provision for compensatory payments and commuted pension gratuity payments under the Voluntary Retirement Scheme and Voluntary Departure Scheme introduced in 2000-2001. These payments are one-off in nature and amount to $5.7 billion in 2001-2002. |
| (2) | For the purpose of the Medium Range Forecast, investment earnings of the Land Fund are consolidated with the General Revenue Account recurrent revenue. |
| (3) | Advances and equity investments from the Capital Investment Fund are excluded from government expenditure (see also Note 1 to Table 4). |
SECTION IV -ESTIMATES OF CONTINGENT LIABILITIES
17 The Government's contingent liabilities are estimated to be $14,000 million at 31 March 2001 and $11,600 million at 31 March 2002 respectively, comprising:
|
2000-2001 |
2001-2002 |
|
|
$m |
$m |
|
| Guarantee to the Hong Kong Export Credit Insurance Corporation for liabilities under contracts of insurance |
7,100 |
7,500 |
| Litigation | 300 | 300 |
| Possible capital subscriptions to the Asian Development Bank |
1,900 |
1,900 |
| Guarantees provided under the Special Finance Scheme for Small and Medium Enterprises |
4,700 |
1,900 |
|
_________ |
________ |
|
| Total |
14,000 |
11,600 |
|
_________ |
________ |
APPENDIX B TRENDS IN PUBLIC EXPENDITURE 1996-1997 TO 2001-2002
|
||||||||||||||||||||||||||||||||||||||||||||||||||||||||||||||||||||||||||||||||||||||||||||||||||||||||||||||||||||||||||||||||||||||||||||||||||||||||||||||||||||||||||||||||||||||||||||||||||||||||||||||||||||||||||||||||||||||||||||||||||||||||||||||||||||||||||||||||||||||||||||||||||||||||||||||||||||||||||||||||||||||||||||||||||||||||||||||||||||||||||||||||||||||||||||||||||||||||||||||||||||||||||||||||||||||||||||||||||||||||||||||||||||||||||||||||||||||||||||||||||||||||||||||||||||||||||||||||||||||||||||||||||||||||||||||||||||||||||||||||||||||||||||||||||||||||||||||||||||||||||||||||||||||||||||||||||||||||||||||||||||||||||||||||||||||||||||||||||||||||||||||||||||||||||||||||||||||||||||||||||||||||||||||||||||||||||||||||||||||||||||||||||||||||||||||||||||||||||||||||||||||||||||||||||||||||||||||||||||||||||||||
| INTRODUCTION The purpose of this appendix is to present trends in public expenditure over the period 1996-1997 to 2001-2002. This analysis is expressed in public expenditure terms as defined in Table 4 of Appendix A and includes expenditure by the Trading Funds, the Housing Authority, the Lotteries Fund and the previous Provisional Urban Council and Provisional Regional Council (up to 31 December 1999). It shows the actual and estimated recurrent and total expenditure during this period and expresses this in terms of ten main policy area groups (an index showing the policy areas forming part of these ten main groups is provided at index of policy area groups): Community and External Affairs Where appropriate, policy area groups are further analysed by policy areas. 2 Details of the individual heads of expenditure contributing to a particular policy area are provided in an index in Volume I of the 2001-2002 Estimates. This index further provides details by head of expenditure of individual programmes which contribute to a policy area. 3 The analysis provided in this appendix shows how resources have been and will, in 2001-2002, be allocated to different policy area groups. Where appropriate, historical figures have been adjusted to comply with the current classification of expenditure. HISTORICAL PERSPECTIVE: THE MAJOR FEATURES 4 The changing share of expenditure on policy area groups from 1996-1997 to 2001-2002 is illustrated in Tables 1 and 2. Table 1 relates to recurrent public expenditure and Table 2 to total public expenditure.
5 Recurrent public expenditure and total public expenditure in 2000-2001 and 2001-2002, analysed by policy area groups, are shown in Tables 3 and 4 respectively together with details of the real growths in expenditure between the two years.
|
||||||||||||||||||||||||||||||||||||||||||||||||||||||||||||||||||||||||||||||||||||||||||||||||||||||||||||||||||||||||||||||||||||||||||||||||||||||||||||||||||||||||||||||||||||||||||||||||||||||||||||||||||||||||||||||||||||||||||||||||||||||||||||||||||||||||||||||||||||||||||||||||||||||||||||||||||||||||||||||||||||||||||||||||||||||||||||||||||||||||||||||||||||||||||||||||||||||||||||||||||||||||||||||||||||||||||||||||||||||||||||||||||||||||||||||||||||||||||||||||||||||||||||||||||||||||||||||||||||||||||||||||||||||||||||||||||||||||||||||||||||||||||||||||||||||||||||||||||||||||||||||||||||||||||||||||||||||||||||||||||||||||||||||||||||||||||||||||||||||||||||||||||||||||||||||||||||||||||||||||||||||||||||||||||||||||||||||||||||||||||||||||||||||||||||||||||||||||||||||||||||||||||||||||||||||||||||||||||||||||||||||
APPENDIX C GROWTH IN RECURRENT PUBLIC EXPENDITURE IN 2001-2002 IN MAJOR POLICY AREA GROUPS
|
| The key improvements contributing to the growth in recurrent public expenditure in Education, Health, Security and Social Welfare are detailed below: |
APPENDIX D MAJOR CAPITAL PROJECTS TO BEGIN IN 2001-2002
|
|||||||||||||||||||||||
| Funds allocated for capital projects to start in 2001-2002 include - | |||||||||||||||||||||||
|
APPENDIX E GLOSSARY OF TERMS Note: Terms shown in bold italic are defined elsewhere in the glossary. |
| Capital expenditure. All expenditure charged to the Loan Fund, the Disaster Relief Fund, the Capital Works Reserve Fund and the Innovation and Technology Fund plus expenditure from General Revenue Account on plant, equipment and works and capital subventions, excluding transfers to Funds. It does not include advances and equity investments made from the Capital Investment Fund. Capital revenue. All revenue credited to the Funds and the exceptions listed under recurrent revenue. Cash surplus/deficit. The difference between total Government revenue and total Government expenditure. Consolidated surplus/deficit. Cash surplus/deficit after advances and equity investments from the Capital Investment Fund. Fiscal reserves. The accumulated balances of the General Revenue Account (including the Land Fund) and Funds. They are also known as Government reserves. Funds expenditure. Expenditure charged to the Capital Works Reserve Fund, the Loan Fund, the Disaster Relief Fund, the Capital Investment Fund and the Innovation and Technology Fund. Transfers to or from the Funds are not relevant to the level of expenditure. Funds revenue. All receipts, except transfers from General Revenue Account, which are
credited directly to the Funds. These comprise - Capital Works Reserve Fund donations for projects Loan Fund loan repayments received Capital Investment Fund repayments received Disaster Relief Fund investment income Civil Service Pension Reserve Fund investment income Innovation and Technology Fund loan repayments received For the purpose of the Medium Range Forecast, investment income of the Land Fund is classified as General Revenue Account revenue.
General Revenue Account expenditure. All expenditure charged to General Revenue Account in accordance with the Appropriation Ordinance, excluding transfers to Funds. General Revenue Account revenue. All receipts credited to any of the revenue heads, excluding transfers from Funds. For the purpose of the Medium Range Forecast, the investment earnings of the Land Fund are consolidated with the General Revenue Account revenue. In 2000-2001 and 2001-2002, this excludes exceptional receipts arising from the MTR Privatisation Share Offer (see note (b) under Appendix A paragraph 11). Government expenditure. The aggregate of operating expenditure and capital expenditure. It is not the same as public expenditure. Government revenue. The aggregate of Funds revenue and General Revenue Account revenue, including exceptional receipts in 2000-2001 and 2001-2002 arising from the MTR Privatisation Share Offer. Operating expenditure. All expenditure from General Revenue Account charged to any of the subheads listed in the Estimates under 'Recurrent Account', plus Other Non-Recurrent expenditure. Operating surplus/deficit. The difference between General Revenue Account revenue and General Revenue Account expenditure.
Public expenditure. Government expenditure plus -
Recurrent revenue. All revenue credited to General Revenue Account, excluding transfers from Funds and the following -
Exceptional receipts in 2000-2001 and 2001-2002 arising from MTR Privatisation Share Offer are also treated as capital revenue. Taxation earnings and profits tax |

|
|
 |