|
|
|
 |
|
APPENDICES |
|
A.
MEDIUM RANGE FORECAST 2003-04 TO 2008-09
B.
ANALYSIS OF PUBLIC/GOVERNMENT EXPENDITURE 1999-2000
TO
2004-05
Allocation of resources between policy area groups.
C.
GLOSSARY
OF TERMS
|
|
|
APPENDIX
A
|
|
MEDIUM
RANGE FORECAST
2003-04 TO
2008-09
|
|
INTRODUCTION |
| |
|
The Medium Range Forecast (MRF) is a projection of expenditure and revenue for the forecast period based on the forecasting assumptions and budgetary criteria outlined in Section I of this Appendix. |
| |
2
The MRF is presented in three sections
-
(I)
Forecasting assumptions and budgetary criteria.
(II)
The MRF for 2003-04 to 2008-09.
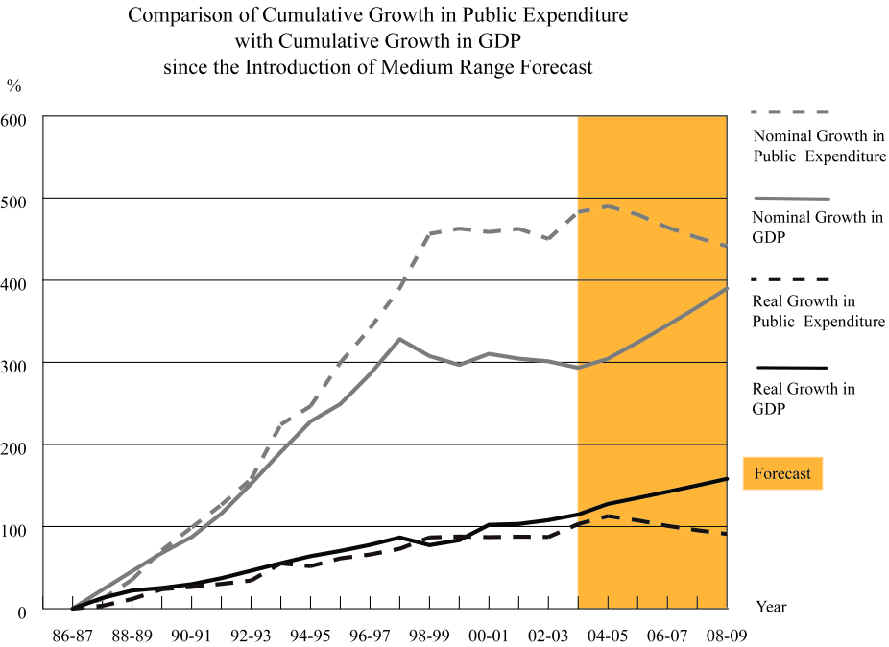
(III) Relationship between Government Expenditure, Public Expenditure
and GDP in the
MRF.
3
Government's contingent liabilities at 31 March 2003 and estimates of these at 31 March 2004 and 31 March 2005 are provided in Section IV of this Appendix as supplementary information to the
MRF.
|
|
|
SECTION
I - FORECASTING ASSUMPTIONS AND BUDGETARY CRITERIA |
| |
|
4
A number of computer based models are used to derive the MRF. These models reflect a wide range of assumptions about the factors determining each of the components of Government's revenue and expenditure. Some are economic in nature (the general economic assumptions) while others deal with specific areas of Government's activity (the detailed assumptions). These are supported by studies of historical and anticipated trends. |
| |
|
General
Economic Assumptions |
|
Real
Gross Domestic Product (real GDP)
|
| |
5
For planning purposes, the assumption on the trend growth rate in real terms of GDP for the medium-term period 2004 to 2008 is set at 3.8% per annum (comprising a 6% growth for 2004, and an average growth of 3.3% per annum for the ensuing period 2005 to 2008).
Price
change
6
Over the period 2004 to 2008, the trend rate of increase in the GDP deflator, measuring overall price change in the economy, is assumed at 0.7% per annum (comprising a decrease of 3% for 2004, and an average increase of 1.6% per annum for the ensuing period 2005 to 2008). The trend rate of increase in the Composite Consumer Price Index, measuring price change in the consumer domain, is assumed at 1% per annum (comprising a decrease of 1% for 2004, and an average increase of 1.5% per annum for the ensuing period 2005 to 2008).
Nominal
Gross Domestic Product (nominal GDP)
7
Taking the assumptions on the trend rates of change in the real GDP and the GDP deflator together, the trend growth rate of nominal GDP is thus assumed at 4.5% per annum for the period 2004 to 2008 (comprising a 2.8% growth for 2004, and an average growth of 4.9% per annum for the ensuing period 2005 to 2008).
|
|
Detailed
Assumptions |
8 The MRF incorporates a wide range of detailed assumptions on expenditure and revenue patterns over the forecast period, taking the following, amongst other factors, into account-
- estimated cash flow of capital projects,
- forecast completion dates of these capital projects and their related recurrent consequences in terms of staffing and running costs,
- estimated cash flow arising from new commitments resulting from policy initiatives,
- the expected pattern of demand for individual services,
- the trend in yield from individual revenue sources, and
- new revenue/expenditure measures in the 2004 Budget.
|
|
Budgetary
Criteria |
9
In addition to the above forecasting assumptions, there are a number of criteria against which the results of forecasts are tested for overall acceptability in terms of budgetary policy.
10
The following are the more important budgetary criteria-
- Budget surplus/deficit
The Government aims to achieve balance in consolidated and operating accounts by 2008-09. In the longer term, the Government needs to achieve an operating surplus to partially finance capital expenditure.
- Operating expenditure
The Government aims to bring operating expenditure down to $200 billion by 2008-09.
- Capital expenditure
By its nature some fluctuations in the level of capital expenditure are to be expected. However, over a period the aim is to contain capital expenditure within overall expenditure guidelines.
- Total expenditure
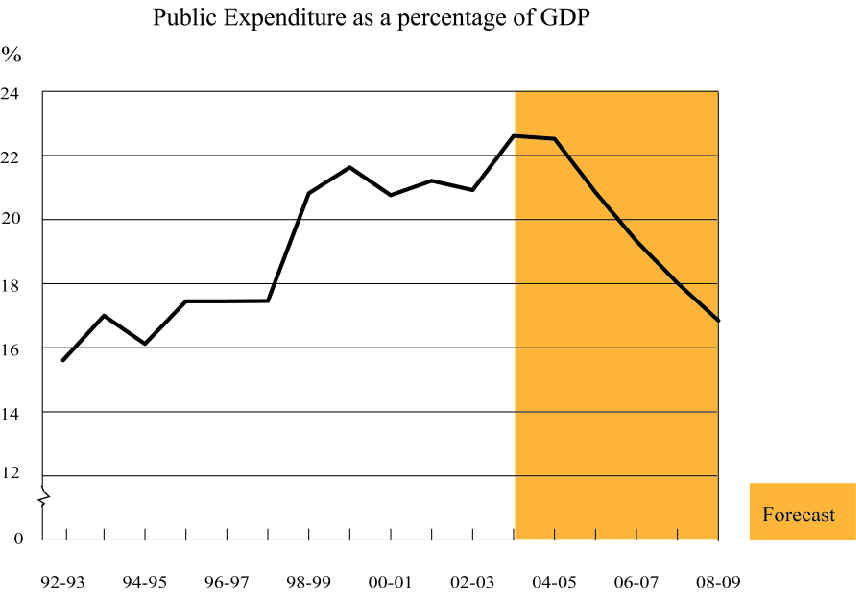
The general principle is that, over time, expenditure growth should not exceed the growth of the economy, taking into account both real and nominal terms. The Government aims to keep public expenditure at or below 20% of GDP by 2008-09.
- Revenue policy
Account is taken of the need to maintain over time the real yield from revenue.
- Fiscal reserves
The Government in the long run aims to maintain the level of reserves at around 12 months of total government expenditure.
|
| |
|
SECTION II - THE MRF FOR 2003-04 TO 2008-09 |
| |
|
11 The current MRF (Note
a) is summarised in the following table which indicates the forecast operating position, capital financing position and consolidated reserves position- |
| |
|
Table 1 |
|
($
million) |
Original Estimate |
Original Estimate as
updated* |
Revised
Estimate |
Forecast |
| 2003-04 |
2003-04 |
2003-04 |
2004-05 |
2005-06 |
2006-07 |
2007-08 |
2008-09 |
| Operating
Account |
| Operating revenue (Note
b) |
149,183 |
143,847 |
147,672 |
155,593 |
162,939 |
171,291 |
179,472 |
189,299 |
| Operating Expenditure
(Note c) |
213,595 |
217,442 |
206,734 |
212,200 |
210,620 |
207,080 |
203,540 |
200,000 |
| Surplus/(deficit) before
investment income |
(64,412) |
(73,595) |
(59,062) |
(56,607) |
(47,681) |
(35,789) |
(24,068) |
(10,701) |
| Investment income
(Note b) |
10,991 |
10,991 |
23,036 |
10,039 |
7,761 |
6,374 |
5,458 |
5,479 |
| Operating surplus/(deficit) after investment income |
(53,421) |
(62,604) |
(36,026) |
(46,568) |
(39,920) |
(29,415) |
(18,610) |
(5,222) |
| Capital Financing Statement |
| Capital revenue (Note
d) |
11,237 |
11,237 |
14,851 |
18,624 |
23,315 |
27,261 |
31,819 |
36,012 |
| Asset sales/securitisation |
21,000 |
21,000 |
15,467 |
17,000 |
31,000 |
15,000 |
22,000 |
11,000 |
| |
32,237 |
32,237 |
30,318 |
35,624 |
54,315 |
42,261 |
53,819 |
47,012 |
| Capital Spending (Note
e) |
47,799 |
47,799 |
46,126 |
53,418 |
52,301 |
45,891 |
39,639 |
37,084 |
| Surplus/(deficit) before investment income |
(15,562) |
(15,562) |
(15,808) |
(17,794) |
2,014 |
(3,630) |
14,180 |
9,928 |
| Investment income (Note
d) |
1,116 |
1,116 |
2,811 |
2,215 |
2,519 |
2,201 |
2,241 |
2,290 |
| Surplus/(deficit) after investment income |
(14,446) |
(14,446) |
(12,997) |
(15,579) |
4,533 |
(1,429) |
16,421 |
12,218 |
| Government bond issuance (Note
f) |
|
|
|
|
|
|
|
|
| - Indicative borrowing |
- |
- |
- |
20,000 |
- |
- |
- |
- |
| - Interest expenses |
- |
- |
- |
500 |
1,000 |
1,000 |
1,000 |
1,000 |
| Capital financing surplus/(deficit) after government bond issuance |
(14,446) |
(14,446) |
(12,997) |
3,921 |
3,533 |
(2,429) |
15,421 |
11,218 |
| Consolidated Reserves |
| Balance at 1 April
(Note g) |
307,014 |
307,014 |
315,471 |
266,448 |
223,801 |
187,414 |
155,570 |
152,381 |
| Operating surplus/(deficit) |
(53,421) |
(62,604) |
(36,026) |
(46,568) |
(39,920) |
(29,415) |
(18,610) |
(5,222) |
| Capital financing surplus/(deficit)
before Government bond issuance |
(14,446) |
(14,446) |
(12,997) |
(15,579) |
4,533 |
(1,429) |
16,421 |
12,218 |
| Consolidated surplus/(deficit) |
(67,867) |
(77,050) |
(49,023) |
(62,147) |
(35,387) |
(30,844) |
(2,189) |
6,996 |
| Government bond issuance (Note
f) |
|
|
|
|
|
|
|
|
| - Indicative borrowing |
- |
- |
- |
20,000 |
- |
- |
- |
- |
| - Interest expenses |
- |
- |
- |
500 |
1,000 |
1,000 |
1,000 |
1,000 |
| Consolidated surplus/(deficit) after government bond issuance |
(67,867) |
(77,050) |
(49,023) |
(42,647) |
(36,387) |
(31,844) |
(3,189) |
5,996 |
| Balance at 31 March
(Note g) |
239,147 |
229,964 |
266,448 |
223,801 |
187,414 |
155,570 |
152,381 |
158,377 |
| As number of months of government expenditure |
11 |
11 |
13 |
10 |
9 |
7 |
8 |
8 |
| Indicative outstanding debt |
|
|
|
|
|
|
|
|
| - Government bonds (Note
f) |
- |
- |
- |
20,000 |
20,000 |
20,000 |
20,000 |
20,000 |
| - Securitisation notes (Note
h) |
- |
- |
- |
6,000 |
5,250 |
4,500 |
3,750 |
3,000 |
|
| |
|
* |
The 2003-04 Original Estimate has been updated to reflect the relief package covering expenditure measures of $3.8 billion and revenue concessions of $5.3 billion for dealing with the outbreak of the Severe and Acute Respiratory Syndrome (SARS). |
|
|
Notes- |
|
(a) |
Accounting
policies |
|
|
|
(i) |
The MRF is prepared on a cash basis and reflects forecast receipts and payments, whether or not they relate to operating or capital transactions. |
|
(ii) |
The MRF includes the General Revenue Account and the Funds (Capital Investment Fund, Capital Works Reserve Fund, Civil Service Pension Reserve Fund, Disaster Relief Fund, Innovation and Technology Fund, Land Fund, Loan Fund, and Lotteries Fund). |
|
|
|
|
(b) |
Operating
revenue |
|
|
|
|
(i) |
The operating revenue has taken into account the revenue-concession and revenue-raising measures proposed in the 2004 Budget. |
|
(ii) |
For the purpose of the MRF, the investment earnings of the balance of the General Revenue Account which are credited to revenue head Properties and Investments and the investment earnings of the Land Fund are consolidated and shown under Investment Income of the Operating Account. The rate of return on investment earnings is assumed at 5% per annum in 2004-05 to 2008-09. |
|
|
|
|
(c) |
Operating
expenditure |
|
|
|
|
(i) |
The operating expenditure in 2003-04 and 2004-05 includes forecast expenditure of $2.6 billion and $4.2 billion respectively for the first and second Voluntary Retirement Schemes. The one-off expenditure under these schemes comprises commuted pensions and compensation for takers of the schemes. |
|
(ii) |
The level of operating expenditure in 2004-05 to 2008-09 has taken into account the 6% reduction in the salaries of the civil service and the salary-related portion of recurrent subventions which will take effect by two equal instalments, i.e. on 1 January 2004 and 1 January 2005. |
|
|
|
|
(d) |
Capital
revenue |
|
|
|
|
(i) |
The breakdown of capital revenue excluding proceeds from sale/securitisation of assets and investment income is-
| |
|
2003-04 |
2004-05 |
2005-06 |
2006-07 |
2007-08 |
2008-09 |
| ($ million) |
| General Revenue
Account |
3,866 |
2,112 |
1,683 |
1,763 |
1,848 |
1,937 |
| Capital Works Reserve
Fund |
5,165 |
12,020 |
18,651 |
22,363 |
26,369 |
30,771 |
| Capital Investment Fund |
2,402 |
2,180 |
1,531 |
1,486 |
1,467 |
948 |
| Civil Service Pension Reserve Fund |
- |
- |
- |
- |
- |
- |
| Innovation and Technology Fund |
8 |
- |
- |
- |
- |
- |
| Loan Fund |
2,544 |
1,417 |
477 |
642 |
1,064 |
1,274 |
| Lotteries Fund |
866 |
895 |
973 |
1,007 |
1,044 |
1,082 |
|
_______ |
_______ |
_______ |
_______ |
_______ |
_______ |
| Total |
14,851 |
18,624 |
23,315 |
27,261 |
31,819 |
36,012 |
|
_______ |
_______ |
_______ |
_______ |
_______ |
_______ |
|
|
|
|
|
|
| |
|
(ii) |
For the purpose of the MRF, the annual land premia included under the Capital Works Reserve Fund for 2005-06 to 2008-09 are respectively assumed at 1.4%, 1.6%, 1.8% and 2% of GDP. |
|
(iii) |
For the purpose of the MRF, the investment earnings of the various Funds other than that of Land Fund (i.e. Capital Investment Fund, Capital Works Reserve Fund, Civil Service Pension Reserve Fund, Disaster Relief Fund, Innovation and Technology Fund, Loan Fund and Lotteries Fund) are consolidated and shown under Investment Income of the Capital Financing Statement. |
|
|
(e) |
Capital Spending |
|
|
|
|
(i) |
The breakdown of capital spending excluding interest on government bonds is-
|
|
|
| |
|
2003-04 |
2004-05 |
2005-06 |
2006-07 |
2007-08 |
2008-09 |
| ($ million) |
| General Revenue Account |
1,984 |
1,805 |
3,860 |
3,970 |
3,970 |
3,970 |
| Capital Works Reserve Fund |
35,593 |
38,072 |
37,010 |
34,266 |
31,650 |
29,470 |
| Capital Investment Fund |
4,253 |
7,379 |
5,921 |
3,623 |
493 |
297 |
| Disaster Relief Fund |
11 |
|
|
|
|
|
| Innovation and Technology Fund |
502 |
644 |
747 |
747 |
747 |
747 |
| Loan Fund |
2,710 |
4,353 |
3,186 |
2,570 |
2,177 |
1,938 |
| Lotteries Fund |
1,073 |
1,165 |
1,577 |
715 |
602 |
662 |
|
_______ |
_______ |
_______ |
_______ |
_______ |
_______ |
| Total |
46,126 |
53,418 |
52,301 |
45,891 |
39,639 |
37,084 |
|
_______ |
_______ |
_______ |
_______ |
_______ |
_______ |
|
|
|
|
|
|
| |
|
(ii) |
Capital expenditure under the General Revenue Account covers purchase of equipment, and works and capital subventions of a minor nature. |
|
(iii) |
Capital expenditure under the Capital Works Reserve Fund covers expenditure on the Public Works Programme, land acquisition, capital subventions, major systems and equipment, and computerisation. Interest on government bonds is charged to the Capital Works Reserve Fund but is shown separately under
Table 1. |
|
(iv) |
Payments from the Capital Investment Fund include advances and equity investments mainly to Trading Funds and government-owned corporations. |
|
(v) |
Capital expenditure under the Disaster Relief Fund provides relief to disasters that occur outside Hong Kong. Because of the unpredictable nature of disasters, no estimate of future expenditure is made for the forecast period. |
|
(vi) |
Capital expenditure under the Innovation and Technology Fund is intended to finance projects to help promote innovation and technology upgrading in manufacturing and service industries. |
|
(vii) |
Capital expenditure under the Loan Fund includes loans to schools, teachers, students, housing loans, and loans under the special finance scheme for small and medium enterprises. |
|
(viii) |
Capital expenditure under the Lotteries Fund provides grants, loans and advances for social welfare services. |
|
|
|
| (f) |
Government bond issuance |
|
|
|
|
(i) |
The government bonds are included for indicative purpose. The exact timing for and amount of the bond issue will be subject to review and necessary approval. |
|
(ii) |
For the purpose of the MRF, interest on government bonds is assumed at 5% per annum. The exact interest will be subject to the actual interest rate at the time of the bond issuance. It will be charged as capital expenditure of the Capital Works Reserve Fund. |
|
|
|
| (g) |
Fiscal reserves |
|
|
|
|
The fiscal reserves represent the accumulated balances of the General Revenue Account and the Funds, including the government bond issuance. |
|
|
|
| (h) |
Securitisation notes |
|
|
|
|
The securitisation notes arise from the forecast securitisation in 2004-05 of tolls from government tunnels and bridges. For the purpose of the MRF, the outstanding amount of securitisation notes is assumed to be reducing at a rate of about $750 million each year. Repayment of principal and interest of these notes will be funded by revenue of concerned tunnels and bridges. The revenue forgone has been taken into account when forecasting Government's annual operating revenue. |
|
|
|
|
|
| |
| |
|
SECTION III - RELATIONSHIP BETWEEN GOVERNMENT EXPENDITURE, PUBLIC EXPENDITURE AND GDP IN THE MRF |
| |
|
12 For monitoring purposes, the Government's own expenditure is consolidated with the
expenditure of the Housing Authority and the Trading Funds (collectively referred to as 㺸ther public bodies? in order to compare total public expenditure with Gross Domestic Products. |
| |
|
Government Expenditure and Public Expenditure in the Context
of the Economy |
Table 2 |
|
|
($
million) |
Original Estimate |
Original Estimate as
updated* |
Revised
Estimate |
Forecast |
| 2003-04 |
2003-04 |
2003-04 |
2004-05 |
2005-06 |
2006-07 |
2007-08 |
2008-09 |
| Operating
expenditure |
213,595 |
217,442 |
206,734 |
212,200 |
210,620 |
207,080 |
203,540 |
200,000 |
| Capital expenditure (Note
a) |
43,218 |
43,218 |
41,873 |
46,539 |
47,380 |
43,268 |
40,146 |
37,787 |
| Total government
expenditure |
256,813 |
260,660 |
248,607 |
258,739 |
258,000 |
250,348 |
243,686 |
237,787 |
| Other
public bodies |
29,702 |
29,702 |
30,576 |
27,235 |
19,734 |
19,808 |
20,606 |
21,464 |
| Total public
expenditure (Note b) |
286,515 |
290,362 |
279,183 |
285,974 |
277,734 |
270,156 |
264,292 |
259,251 |
| Gross Domestic Product
(calendar year) |
1,283,230 |
1,283,230 |
1,234,944 |
1,269,744 |
1,332,186 |
1,397,699 |
1,466,434 |
1,538,548 |
| Growth in GDP (Note
c) |
|
|
|
|
|
|
|
|
Money terms |
|
|
-2.0% |
+2.8% |
+4.9% |
+4.9% |
+4.9% |
+4.9% |
Real terms
|
|
|
+3.3% |
+6.0% |
+3.3% |
+3.3% |
+3.3% |
+3.3% |
| Growth in government
expenditure (Note d) |
|
|
|
|
|
|
|
|
Money terms
|
|
|
+4.8% |
+4.1% |
-0.3% |
-3.0% |
-2.7% |
-2.4% |
Real terms
|
|
|
+7.2% |
+6.5% |
+0.2% |
-3.4% |
-3.1% |
-2.8% |
| Growth in public
expenditure (Note d) |
|
|
|
|
|
|
|
|
Money terms
|
|
|
+5.9% |
+2.4% |
-2.9% |
-2.7% |
-2.2% |
-1.9% |
Real terms
|
|
|
+8.4% |
+4.8% |
-2.5% |
-3.2% |
-2.6% |
-2.3% |
| Public expenditure as
a percentage of GDP |
22.3% |
22.6% |
22.6% |
22.5% |
20.8% |
19.3% |
18.0% |
16.9% |
|
|
* |
The 2003-04 Original Estimate has been updated to reflect the relief package for dealing with the outbreak of SARS. See
note below Table 1. |
|
|
Notes- |
|
(a) |
Capital expenditure includes interest on government bonds charged to Capital Works Reserve Fund. |
|
|
| (b) |
Public expenditure comprises government expenditure (i.e. all expenditure charged to the General Revenue Account and financed by the Government's statutory funds excluding Capital Investment Fund), and expenditure by the Trading Funds and the Housing Authority. But not included is expenditure by those organisations, including statutory organisations, in which the Government has only an equity position, such as the Airport Authority, the MTR Corporation Ltd and the Kowloon-Canton Railway Corporation. Similarly, advances and equity investments from the Capital Investment Fund are excluded as they do not reflect the actual consumption of resources by the Government. |
|
|
| (c) |
Over the period 2004-2008, the forecast trend growth rate of GDP in real terms is 3.8% per annum and, with the forecast trend rate of increase in the GDP deflator at 0.7% per annum, the forecast trend growth rate in nominal GDP is 4.5%. |
|
|
| (d) |
The growth rates refer to year-on-year change. For example, the rates for 2003-04 refer to the change between revised estimate for 2003-04 and actual expenditure in 2002-03. The rates for 2004-05 refer to the change between the 2004-05 forecast over 2003-04 revised estimate and so forth. |
|
|
|
|
13 Table 3 shows the relationship amongst the sum to be appropriated in the 2004 Budget, government expenditure and public expenditure. It also shows the effect of the Budget revenue measures on the overall surplus/deficit position for 2004-05. |
| |
|
Relationship between Government
Expenditure
and Public Expenditure in 2004-05 |
Table 3 | |
|
($ million) |
| Components of expenditure and
revenue |
Appropriation |
Government
expenditure and
revenue |
Public Expenditure |
| Operating |
Capital |
Total |
| Expenditure |
|
|
|
|
|
| General
Revenue Account: |
|
|
|
|
|
|
|
|
|
|
|
|
Recurrent
|
203,469 |
203,469 |
- |
203,469 |
203,469 |
Non-recurrent
|
8,731 |
8,731 |
- |
8,731 |
8,731 |
|
|
|
|
|
|
|
|
|
917 |
- |
917 |
917 |
917 |
|
|
888 |
- |
888 |
888 |
888 |
| |
214,005 |
212,200 |
1,805 |
214,005 |
214,005 |
|
|
30,943 |
- |
- |
- |
- |
| Capital Works Reserve
Fund |
- |
- |
38,072 |
38,072 |
38,072 |
| Innovation and Technology
Fund |
- |
- |
644 |
644 |
644 |
| Loan Fund |
- |
- |
4,353 |
4,353 |
4,353 |
| Lotteries Fund |
- |
- |
1,165 |
1,165 |
1,165 |
| Trading Funds |
- |
- |
- |
- |
3,134 |
| Housing Authority |
- |
- |
- |
- |
24,101 |
| |
244,948 |
212,200 |
46,039 |
258,239 |
285,474 |
| Revenue (before Budget revenue
measures) |
|
|
|
|
|
| General Revenue
Account: |
|
|
|
|
|
|
|
|
132,278 |
1,510 |
133,788 |
|
|
|
|
28,453 |
602 |
29,055 |
|
| |
|
160,731 |
2,112 |
162,843 |
|
| Land Fund |
|
7,061 |
- |
7,061 |
|
| |
|
167,792 |
2,112 |
169,904 |
|
| |
|
|
|
|
|
| Capital Works Reserve
Fund |
|
- |
13,041 |
13,041 |
|
| Capital Investment Fund |
|
- |
2,190 |
2,190 |
|
| Civil Service Pension Reserve
Fund |
|
- |
744 |
744 |
|
| Disaster Relief Fund |
|
- |
2 |
2 |
|
| Innovation and Technology
Fund |
|
- |
221 |
221 |
|
| Loan Fund |
|
- |
1,426 |
1,426 |
|
| Lotteries Fund |
|
- |
1,103 |
1,103 |
|
| Asset sales/securitisation |
|
- |
17,000 |
17,000 |
|
| |
|
167,792 |
37,839 |
205,631 |
|
| Surplus/(deficit) before Budget
revenue measures |
|
(44,408) |
(8,200) |
(52,608) |
|
| Less: |
Effect of Budget revenue
measures |
|
2,160 |
- |
2,160 |
|
| Surplus/(deficit) after Budget
revenue measures |
|
(46,568) |
(8,200) |
(54,768) |
|
| Less: |
Advances and equity investments
from the Capital Investment Fund (Note
a) |
|
- |
7,379 |
7,379 |
|
| Consolidated surplus/(deficit) before government bond issuance |
|
(46,568) |
(15,579) |
(62,147) |
|
| Government bond issuance |
|
|
|
|
|
Indicative borrowing
|
|
- |
20,000 |
20,000 |
|
Interest expenses (Note b)
|
|
- |
500 |
500 |
|
| Consolidated surplus/(deficit) after government bond issuance |
|
(46,568) |
3,921 |
(42,647) |
| |
|
Notes - |
| (a) |
Advances and equity investments from the Capital Investment Fund are excluded from government expenditure (see also
Note b to Table 2) |
| (b) |
Interest on government bonds will be charged as capital expenditure of the Capital Works Reserve Fund. |
|
| |
|
SECTION IV - ESTIMATES OF CONTINGENT LIABILITIES |
| |
|
14 The Government's contingent liabilities are $17,743 million at 31 March 2003 and
estimated to be $19,141 million at 31 March 2004 and $21,078 million at 31 March 2005, comprising- |
| |
| (at 31 March) |
2003 |
2004 |
2005 |
|
$m |
$m |
$m |
| Guarantee to the Hong Kong Export Credit Insurance Corporation for liabilities under contracts of insurance |
9,628 |
9,416 |
9,642 |
| Litigation |
4,709 |
4,605 |
4,716 |
| Possible capital subscriptions to the Asian Development Bank |
1,920 |
1,920 |
1,920 |
| Guarantees provided under the SME Business Installations and Equipment Loan Guarantee Scheme, the Special Finance Scheme for Small and Medium Enterprises, the Film Guarantee Fund and the Loan Guarantee Scheme for Severe Acute Respiratory Syndrome Impacted Industries |
1,486 |
3,200 |
4,800 |
|
_________ |
________ |
________ |
| Total |
17,743 |
19,141 |
21,078 |
|
_________ |
________ |
________ | |
|
|
| |
| |
|
APPENDIX
B
ANALYSIS OF PUBLIC /
GOVERNMENT EXPENDITURE 1999-2000 TO 2004-05
|
|
| CONTENTS
SECTION I - THE ESTIMATES IN THE CONTEXT OF THE ECONOMY
Relationship
between Government Expenditure,
Public Expenditure in 2004-05 and GDP
Section
II - Analysis of Recurrent Public/Government Expenditure
by Policy Area Group
Recurrent
Public Expenditure -
Year-on-Year Change
Recurrent Government Expenditure -
Year-on-Year Change
Percentage Share of Expenditure by
Policy Area Group ?/span>
Recurrent
Public Expenditure
Recurrent Government Expenditure
Section
III - Analysis of Total Public/Government Expenditure by
Policy Area Group
Total
Public
Expenditure ?
Year-on-Year Change
Total Government
Expenditure ?
Year-on-Year Change
Percentage Share of Expenditure by
Policy Area Group ?/span>
Total
Public Expenditure
Total Government Expenditure
Section
IV - Major Capital Projects to Begin in 2004-05
Section
V - Trends in Public Expenditure : 1999-2000 to 2004-05
Section
VI - Key to Classification of Expenditure
|
|
|
Relationship
between Government Expenditure, Public Expenditure in
2004-05 and GDP
|
|
(All
figure in $million) |
|
Public
Expenditure |
| General
Revenue Account
|
|
|
|
212,200 |
|
|
1,805 |
|
_________ |
|
214,005 |
|
|
| Capital
Works Reserve Fund
|
38,572 |
| Loan
Fund |
4,353 |
|
|
| Lotteries
Fund |
1,165 |
|
|
| Innovation
and Technology Fund |
644 |
|
_________ |
| Government
Expenditure |
258,739 |
|
|
| Trading
Funds |
3,134 |
|
|
| Housing Authority |
24,101 |
|
_________ |
|
285,974 |
|
_________ |
| GDP |
1,269,744 |
|
|
| Public Expenditure as a % of GDP |
22.5% |
|
|
|
|
| Section II - Analysis of
Recurrent Public/Government Expenditure by Policy
Area Group |
|
| Recurrent Public Expenditure : Year-on-Year Change |
|
|
(All figure in
$million) |
|
|
|
|
% Increase/Decrease
over 2003-04
original estimate |
|
2003-04
Original
Estimate |
2003-04
Revised
Estimate |
2004-05
Estimate |
in
Nominal
Terms |
in Real Terms |
|
|
|
|
|
(Note) |
| Education |
49,261 |
46,761 |
49,189 |
-0.1 |
+2.4 |
|
|
|
|
|
|
| Social Welfare |
32,765 |
32,512 |
33,715 |
+2.9 |
+6.3 |
|
|
|
|
|
|
| Health |
31,889 |
31,706 |
30,325 |
-4.9 |
-2.1 |
|
|
|
|
|
|
| Security |
25,015 |
24,483 |
23,949 |
-4.3 |
-1.6 |
|
|
|
|
|
|
| Housing |
13,029 |
11,849 |
12,806 |
-1.7 |
+0.2 |
|
|
|
|
|
|
| Infrastructure |
11,762 |
11,392 |
11,367 |
-3.4 |
-1.4 |
|
|
|
|
|
|
| Economic |
11,138 |
10,857 |
10,844 |
-2.6 |
-0.5 |
|
|
|
|
|
|
| Environment and Food |
8,759 |
8,315 |
8,198 |
-6.4 |
-4.4 |
|
|
|
|
|
|
| Community and External Affairs |
7,568 |
7,350 |
7,116 |
-6.0 |
-4.2 |
|
|
|
|
|
|
| Support |
31,314 |
29,235 |
31,296 |
-0.1 |
+0.9 |
|
|
|
|
|
|
|
________ |
________ |
________ |
|
|
|
|
|
|
|
|
|
222,500 |
214,460 |
218,805 |
-1.7 |
+0.7 |
|
|
|
|
|
|
|
________ |
________ |
________ |
|
|
|
|
|
|
|
|
|
|
|
Note: |
As the above 2004-05 estimates has included assumptions on price changes for various expenditure components (e.g. operating expenses, plant and equipment, etc.) and the two-phased reduction in salaries for the civil service and the salary-related portion of recurrent subventions on 1 January 2004 and 1 January 2005, the percentage increase/decrease in real terms is calculated after adjustment to bring the expenditure figures for 2003-04 and 2004-05 to the same price level. |
|
|
| |
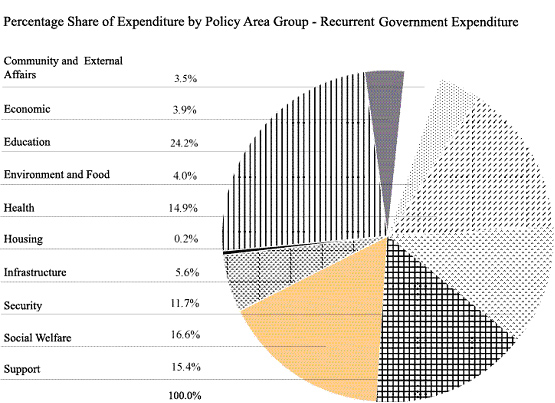
Recurrent
Government Expenditure : Year-on-Year Change
|
|
|
(All figure in
$million) |
|
|
|
|
% Increase/Decrease
over 2003-04
original estimate |
|
2003-04
Original
Estimate |
2003-04
Revised
Estimate |
2004-05
Estimate |
in
Nominal
Terms |
in Real Terms |
|
|
|
|
|
(Note) |
| Education |
49,261 |
46,761 |
49,189 |
-0.1 |
+2.4 |
|
|
|
|
|
|
| Social Welfare |
32,765 |
32,512 |
33,715 |
+2.9 |
+6.3 |
|
|
|
|
|
|
| Health |
31,889 |
31,706 |
30,325 |
-4.9 |
-2.1 |
|
|
|
|
|
|
| Security |
25,015 |
24,483 |
23,949 |
-4.3 |
-1.6 |
|
|
|
|
|
|
| Infrastructure |
11,614 |
11,260 |
11,248 |
-3.2 |
-1.2 |
|
|
|
|
|
|
| Environment and Food |
8,759 |
8,315 |
8,198 |
-6.4 |
-4.4 |
|
|
|
|
|
|
| Economic |
8,266 |
7,935 |
7,978 |
-3.5 |
-1.2 |
|
|
|
|
|
|
| Community and External Affairs |
7,568 |
7,350 |
7,116 |
-6.0 |
-4.2 |
|
|
|
|
|
|
| Housing |
531 |
471 |
455 |
-14.3 |
-13.0 |
|
|
|
|
|
|
| Support |
31,314 |
29,235 |
31,296 |
-0.1 |
+0.9 |
|
|
|
|
|
|
|
________ |
________ |
________ |
|
|
|
|
|
|
|
|
|
206,982 |
200,028 |
203,469 |
-1.7 |
+0.7 |
|
|
|
|
|
|
|
________ |
________ |
________ |
|
|
|
|
|
|
|
|
|
|
|
Note: |
As the above 2004-05 estimates has included assumptions on price changes for various expenditure components (e.g. operating expenses, plant and equipment, etc.) and the two-phased reduction in salaries for the civil service and the salary-related portion of recurrent subventions on 1 January 2004 and 1 January 2005, the percentage increase/decrease in real terms is calculated after adjustment to bring the expenditure figures for 2003-04 and 2004-05 to the same price level. |
|
|
|
|
| SECTION III - ANALYSIS OF TOTAL PUBLIC/GOVERNMENT EXPENDITURE BY POLICY AREA GROUP |
|
| Total Public Expenditure : Year-on-Year Change |
|
|
|
|
|
|
|
% Increase/Decrease
over 2003-04
original estimate |
|
2003-04
Original
Estimate |
2003-04
Revised
Estimate |
2004-05
Estimate |
in
Nominal
Terms |
in Real Terms |
| (All figures in $million) |
|
|
|
|
(Note) |
| Education |
61,023 |
57,748 |
59,542 |
-2.4 |
-0.1 |
|
|
|
|
|
|
| Social Welfare |
33,974 |
33,997 |
35,404 |
+4.2 |
+7.6 |
|
|
|
|
|
|
| Health |
33,404 |
34,485 |
32,977 |
-1.3 |
+1.7 |
|
|
|
|
|
|
| Infrastructure |
27,092 |
26,363 |
30,173 |
+11.4 |
+14.0 |
|
|
|
|
|
|
| Security |
27,915 |
27,456 |
27,032 |
-3.2 |
-0.6 |
|
|
|
|
|
|
| Housing |
26,942 |
27,854 |
24,583 |
-8.8 |
-6.9 |
|
|
|
|
|
|
| Economic |
17,118 |
15,561 |
16,675 |
-2.6 |
-0.7 |
|
|
|
|
|
|
| Environment and Food |
11,348 |
11,213 |
12,604 |
+11.1 |
+13.3 |
|
|
|
|
|
|
| Community and External Affairs |
8,956 |
8,256 |
8,593 |
-4.1 |
-2.2 |
|
|
|
|
|
|
| Support |
38,743 |
35,980 |
38,391 |
-0.9 |
+0.1 |
|
|
|
|
|
|
|
________ |
________ |
________ |
|
|
|
|
|
|
|
|
|
286,515 |
279,183 |
285,974 |
-0.2 |
+2.1 |
|
|
|
|
|
|
|
________ |
________ |
________ |
|
|
|
|
|
|
|
|
|
|
|
Note: |
As the above 2004-05 estimates has included assumptions on price changes for various expenditure components (e.g. operating expenses, plant and equipment, etc.) and the two-phased reduction in salaries for the civil service and the salary-related portion of recurrent subventions on 1 January 2004 and 1 January 2005, the percentage increase/decrease in real terms is calculated after adjustment to bring the expenditure figures for 2003-04 and 2004-05 to the same price level. |
|
|
| Total Government Expenditure : Year-on-Year Change |
|
|
|
|
|
|
|
% Increase/Decrease
over 2003-04
original estimate |
|
2003-04
Original
Estimate |
2003-04
Revised
Estimate |
2004-05
Estimate |
in
Nominal
Terms |
in Real Terms |
| (All figure in $million) |
|
|
|
|
(Note) |
| Education |
61,023 |
57,748 |
59,542 |
-2.4 |
-0.1 |
|
|
|
|
|
|
| Social Welfare |
33,974 |
33,997 |
35,404 |
+4.2 |
+7.6 |
|
|
|
|
|
|
| Health |
33,404 |
34,485 |
32,977 |
-1.3 |
+1.7 |
|
|
|
|
|
|
| Infrastructure |
26,865 |
26,184 |
30,024 |
+11.8 |
+14.4 |
|
|
|
|
|
|
| Security |
27,915 |
27,456 |
27,032 |
-3.2 |
-0.6 |
|
|
|
|
|
|
| Economic |
13,987 |
12,493 |
13,690 |
-2.1 |
-0.2 |
|
|
|
|
|
|
| Environment and Food |
11,348 |
11,213 |
12,604 |
+11.1 |
+13.3 |
|
|
|
|
|
|
| Community and External Affairs |
8,956 |
8,526 |
8,593 |
-4.1 |
-2.2 |
|
|
|
|
|
|
| Housing |
598 |
525 |
482 |
-19.4 |
-18.2 |
|
|
|
|
|
|
| Support |
38,743 |
35,980 |
38,391 |
-0.9 |
+0.1 |
|
|
|
|
|
|
|
________ |
________ |
________ |
|
|
|
|
|
|
|
|
|
256,813 |
248,607 |
258,739 |
+0.7 |
+3.1 |
|
|
|
|
|
|
|
________ |
________ |
________ |
|
|
|
|
|
|
|
|
|
|
|
Note: |
As the above 2004-05 estimates has included assumptions on price changes for various expenditure components (e.g. operating expenses, plant and equipment, etc.) and the two-phased reduction in salaries for the civil service and the salary-related portion of recurrent subventions on 1 January 2004 and 1 January 2005, the percentage increase/decrease in real terms is calculated after adjustment to bring the expenditure figures for 2003-04 and 2004-05 to the same price level. |
|
|
|
|
|
|
| SECTION IV - MAJOR CAPITAL PROJECTS TO BEGIN IN 2004-05 |
|
| Funds allocated for capital projects to start in 2004-05 include: |
|
|
$million
|
|
|
| Infrastructure |
15,686 |
| - |
Reconstruction and improvement of Tuen Mun Road |
|
| - |
South East Kowloon development related works |
|
| - |
Improvement to San Tin Interchange |
|
| - |
In-situ reprovisioning of Sha Tin water treatment works |
|
| - |
Retro-fitting of noise barriers at selected locations |
|
| - |
Reconstruction of public piers |
|
|
|
|
| Education |
2,541 |
| - |
Construction of additional primary and secondary schools |
|
| - |
Multi-media Building, City University of Hong Kong |
|
| - |
Teaching complex at western campus, Chinese University of Hong Kong |
|
|
|
|
|
Support |
1,464 |
| - |
Drainage improvement in East Kowloon, Tsuen Wan, Kwai Chung, Tsing Yi and
Northern New Territories |
|
| - |
Village flood protection in North West New Territories |
|
|
|
|
|
Economic |
764 |
| - |
Tsim Sha Tsui Promenade Beautification Project |
|
| - |
Transport link in Tsim Sha Tsui East |
|
| - |
Enhancement of public facilities at Ngong Ping, Lantau |
|
| - |
Enhancement of tourism facilities |
|
|
|
|
| Community and External
Affairs |
681 |
|
- |
Tseung Kwan O Sports Ground |
|
|
- |
Renovation of libraries |
|
|
|
|
| Health |
641 |
| - |
Construction of a new infectious disease centre attached to Princess Margaret Hospital |
|
| - |
Provision of additional lifts and associated works at Block S of United Christian Hospital |
|
|
|
|
| Environment and
Food |
607 |
|
- |
Central, Western and Wan Chai West sewerage, stage 2 phase 2B works |
|
|
- |
General improvement works to markets and cooked food centres |
|
| - |
Reprovisioning of Diamond Hill Crematorium |
|
|
|
|
| Security |
106 |
|
- |
Kowloon Tong fire station-cum-ambulance depot and Kowloon Fire Command Headquarters |
|
|
|
|
|
|
| SECTION V - TRENDS IN PUBLIC EXPENDITURE : 1999-2000 TO 2004-05 |
|
| Introduction |
|
|
This section presents trends in public expenditure over the period 1999-2000 to 2004-05. The analysis includes expenditure by the Government, the Trading Funds and the Housing Authority
2 Details of the individual heads of expenditure contributing to a particular policy area are provided in an index in Volume I of the 2004-05 Estimates. This index further provides details by head of expenditure of individual programmes which contribute to a policy area.
3 Where appropriate, historical figures have been adjusted to comply with the current classification of expenditure.
|
| Recurrent Public Expenditure by Policy Area Group 1999-2000 to 2004-05 |
|
|
Policy Area
Groups |
Actual |
Revised Estimate |
Estimate |
| 1999-2000 |
2000-01 |
2001-02 |
2002-03 |
2003-04 |
2004-05 |
| % |
% |
% |
% |
% |
% |
| Education |
22.0 |
22.3 |
22.0 |
22.2 |
21.8 |
22.5 |
| Social
Welfare |
13.7 |
13.8 |
13.8 |
14.8 |
15.2 |
15.4 |
| Health |
15.3 |
15.4 |
15.2 |
15.3 |
14.8 |
13.9 |
| Security |
12.3 |
12.0 |
11.7 |
11.5 |
11.4 |
10.9 |
| Housing |
6.0 |
5.8 |
5.8 |
5.4 |
5.5 |
5.9 |
| Infrastructure |
5.5 |
5.4 |
5.4 |
5.4 |
5.3 |
5.2 |
| Economic |
5.2 |
5.2 |
5.1 |
5.0 |
5.1 |
5.0 |
| Environment and
Food |
4.2 |
4.0 |
3.9 |
4.0 |
3.9 |
3.7 |
| Community and External
Affairs |
3.6 |
3.4 |
3.4 |
3.5 |
3.4 |
3.2 |
| Support |
12.2 |
12.7 |
13.7 |
12.9 |
13.6 |
14.3 |
| |
100.0 |
100.0 |
100.0 |
100.0 |
100.0 |
100.0 |
| |
| |
$m |
$m |
$m |
$m |
$m |
$m |
| Total Recurrent Public Expenditure |
195,272
|
198,619
|
210,445
|
211,728
|
214,460
|
218,805
|
|
|
| Total Public Expenditure by Policy Area Group 1999-2000 to 2004-05 |
|
|
Policy Area
Groups |
Actual |
Revised Estimate |
Estimate |
| 1999-2000 |
2000-01 |
2001-02 |
2002-03 |
2003-04 |
2004-05 |
| % |
% |
% |
% |
% |
% |
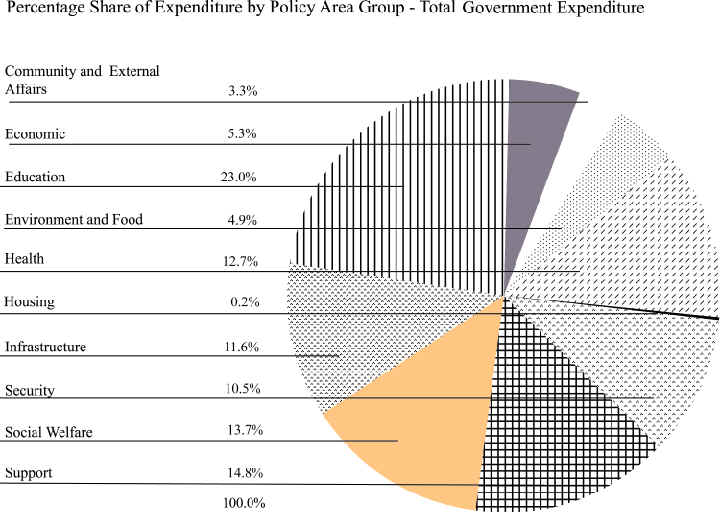
| Education |
18.7 |
19.2 |
19.4 |
20.8 |
20.7 |
20.8 |
| Social
Welfare |
10.2 |
10.5 |
11.2 |
12.3 |
12.2 |
12.4 |
| Health |
11.8 |
12.2 |
12.7 |
12.6 |
12.4 |
11.5 |
| Infrastructure |
8.5 |
8.6 |
9.3 |
9.3 |
9.4 |
10.6 |
| Security |
9.6 |
10.0 |
10.2 |
10.3 |
9.8 |
9.5 |
| Housing |
17.0 |
15.9 |
11.9 |
9.1 |
10.0 |
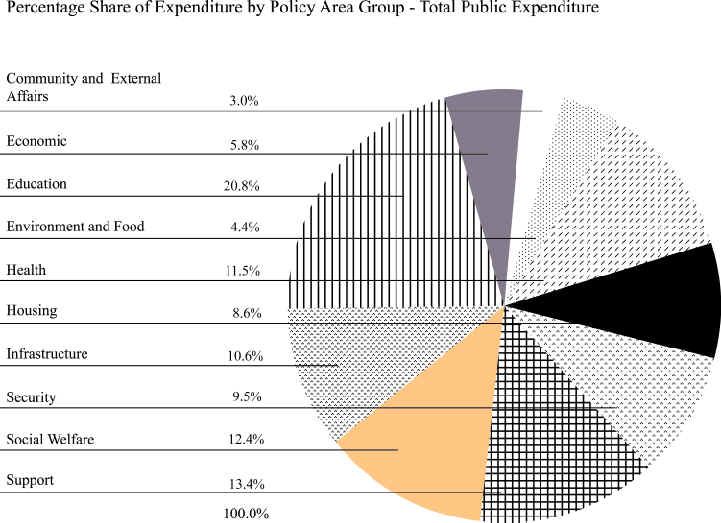
8.6 |
| Economic |
4.6 |
4.7 |
5.1 |
5.2 |
5.6 |
5.8 |
| Environment and
Food |
4.6 |
4.2 |
4.1 |
4.3 |
4.0 |
4.4 |
| Community and External
Affairs |
3.4 |
3.1 |
3.1 |
3.1 |
3.0 |
3.0 |
| Support |
11.6 |
11.6 |
13.0 |
13.0 |
12.9 |
13.4 |
| |
100.0 |
100.0 |
100.0 |
100.0 |
100.0 |
100.0 |
| |
| |
$m |
$m |
$m |
$m |
$m |
$m |
| Total Public Expenditure |
269,484
|
267,507
|
269,359
|
263,520
|
279,183
|
285,974
|
|
|
| SECTION VI - KEY TO CLASSIFICATION OF EXPENDITURE
|
|
|
Index Of Policy Area Groups |
|
|
| Policy Area
Group |
Description by Policy
Area |
Reference
(Note) |
Community and
External
Affairs |
District and Community
Relations |
19 |
|
| Recreation, Culture,
Amenities and Entertainment Licensing |
18 |
|
|
|
|
|
| Economic |
Air and Sea Communications
and Logistics Development |
3 |
|
|
Commerce and
Industry |
6 |
|
|
Employment and
Labour |
8 |
|
|
Financial
Services |
1 |
|
|
Information Technology and
Broadcasting |
17 |
|
|
Manpower
Development |
34 |
|
|
Posts, Power,
Competition Policy and Consumer
Protection |
4 |
|
|
Public Safety |
7 |
|
|
Travel and
Tourism |
5 |
|
|
|
|
|
| Education |
Education |
16 |
|
|
|
|
|
| Environment and
Food |
Environmental
Hygiene |
32 |
|
|
Environmental Protection
and Conservation |
23 |
|
|
Agriculture, Fisheries and
Food Safety |
2 |
|
|
|
|
|
| Health |
Health |
15 |
|
|
|
|
|
| Housing |
Housing |
31 |
|
|
|
|
|
| Infrastructure |
Buildings, Lands and
Planning |
22 |
|
|
Transport |
21 |
|
|
Water Supply |
24 |
|
|
|
|
|
| Security |
Immigration
Control |
10 |
|
|
Internal Security |
9 |
|
|
Administration of
Justice |
12 |
|
|
Anti-Corruption |
13 |
|
|
Legal
Administration |
11 |
|
|
Legal Aid |
20 |
|
|
|
|
|
| Social Welfare |
Social Welfare |
14 |
|
|
Women's
Interest |
33 |
|
|
|
|
|
| Support |
Central Management of the
Civil Service |
26 |
|
|
Complaints Against
Maladministration |
30 |
|
|
Constitutional
Affairs |
28 |
|
|
Intra-governmental
Services |
27 |
|
|
Revenue Collection and
Financial Control |
25 |
|
|
Support for Members of the
Legislative Council |
29 |
|
|
|
|
| |
| Note: |
The Policy Area Reference corresponds with that used in the Index of Policy Areas in the
Estimates of Expenditure. |
|
|
APPENDIX C
|
|
GLOSSARY OF TERMS |
|
|
Note: Terms
shown in bold italic are defined
elsewhere in the glossary. |
|
Capital
expenditure.
This comprises all expenditure charged to the Capital Works Reserve Fund (including interest on government bonds), Disaster Relief Fund, Loan Fund, Innovation and Technology Fund and Lotteries Fund plus Capital Account expenditure from the General Revenue Account. It excludes transfers between General Revenue Account and the Funds, and advances and equity investments made from the Capital Investment Fund.
Capital
revenue.
This comprises all revenue credited to the Funds
(funds revenue) and the exceptions credited to the General Revenue Account as listed under
operating revenue. It excludes Land Fund investment income and transfers from General Revenue Account.
Consolidated
surplus/deficit.
Fiscal
reserves.
The accumulated balances of the General Revenue Account and the Funds, including the government bonds issuance.
Funds
revenue.
All receipts, except transfers from General Revenue Account, which are credited directly to the Funds. These mainly comprise-
Capital
Investment Fund
repayments
received
dividends
interest on loans
interest on
balances
Capital Works
Reserve Fund
donations for
projects
land premia
investment
income
recovery from MTR Corporation Limited
recoveries from Trading Funds
net proceeds from offering of government bonds
Civil Service
Pension Reserve Fund
investment
income
Disaster Relief
Fund
investment
income
Innovation and Technology
Fund
loan repayments
received
investment income
Land
Fund
investment income
Loan
Fund
loan repayments received
interest
on loans
interest on
balances
Lotteries
Fund
loan repayments received
share of
proceeds from the Mark Six Lottery
investment
income
Funds spending.
Expenditure charged to Capital Works Reserve Fund including interest on Government bonds, Capital Investment Fund, Disaster Relief Fund, Loan Fund, Innovation and Technology Fund and Lotteries Fund, but excluding transfers from the Funds.
General Revenue Account
expenditure.
All expenditure charged to General Revenue Account in accordance with the Appropriation Ordinance whether operating or capital in nature, excluding transfers to the Funds.
General Revenue Account
revenue.
All receipts credited to any of the revenue heads, excluding transfers from the Funds.
Government
expenditure.
The aggregate of operating expenditure and
capital expenditure. It is not the same as
public expenditure.
Government
revenue.
The aggregate of Funds revenue and
General Revenue Account revenue.
Government spending.
The aggregate of government expenditure and advances and equity investments made from the Capital Investment Fund.
Operating
expenditure.
All expenditure from General Revenue Account charged to any of the subheads listed in the Estimates under the Operating Account.
Operating revenue.
This comprises Land Fund investment income and all receipts to be credited to General Revenue Account under any of the following revenue heads, namely-
- Duties
- General Rates
- Internal Revenue
- Motor Vehicle Taxes
- Fines, Forfeitures and Penalties
- Royalties and Concessions
- Properties and Investments
- Loans, Reimbursements, Contributions and Other Receipts (excluding transfers from Funds)
- Utilities
- Fees and Charges
It does not include the following items which are treated as
capital revenue-
- disposal proceeds of government quarters and other assets
- estate duty
- taxi concessions
- recovery from Housing Authority
- donations
- repayment of loans and advances
Operating
surplus/deficit.
The
difference between operating revenue and
operating
expenditure.
Public
expenditure.
Government expenditure
plus expenditure (recurrent and capital) by
the Trading Funds and the Housing
Authority.
|
|
|
|
|
|
|
|
| |
|
|